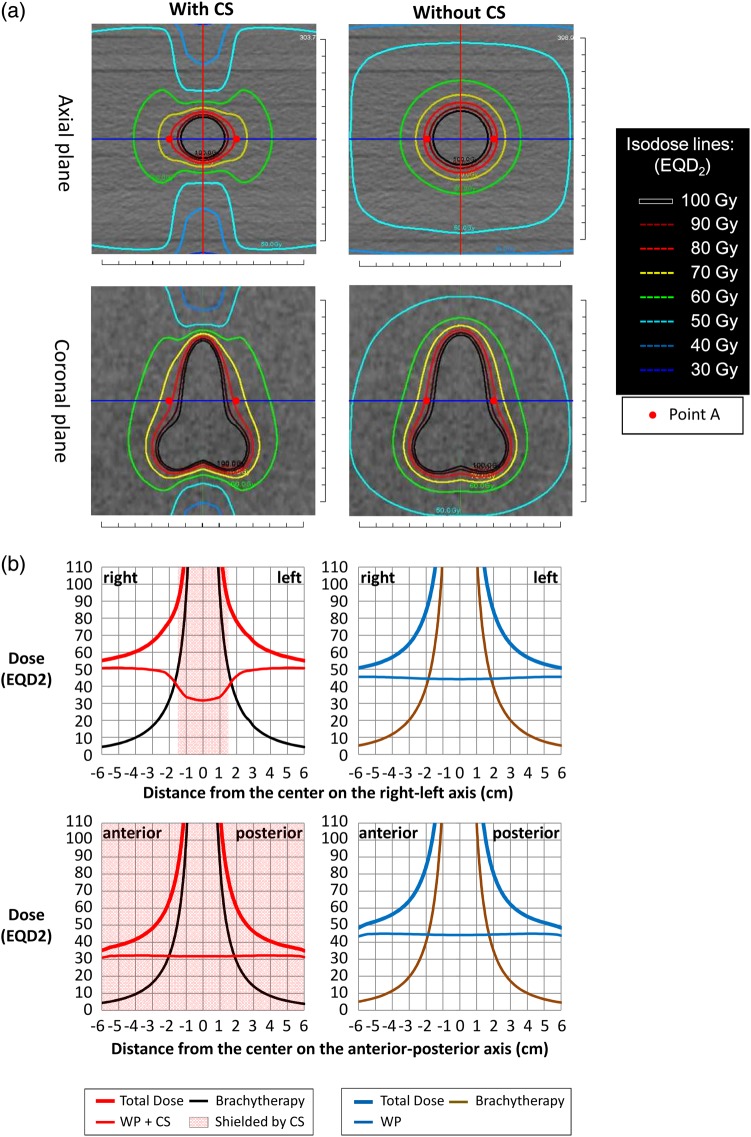
Fig. 1.
(a) The composite EQD2 dose distributions of WP 30 Gy/15 fractions + CS 20 Gy/10 fractions + BT 24 Gy/4 fractions (CS 3 cm) and WP 45 Gy/25 fractions + BT 28 Gy/4 fractions. The composite EQD2 distributions on the axial and coronal images at the level of Point A are shown. (b) The doses of EBRT and ICBT and the total dose in EQD2 on the RL axis [blue lines in (a)] and on the AP axis [red lines in (a)] are shown.

