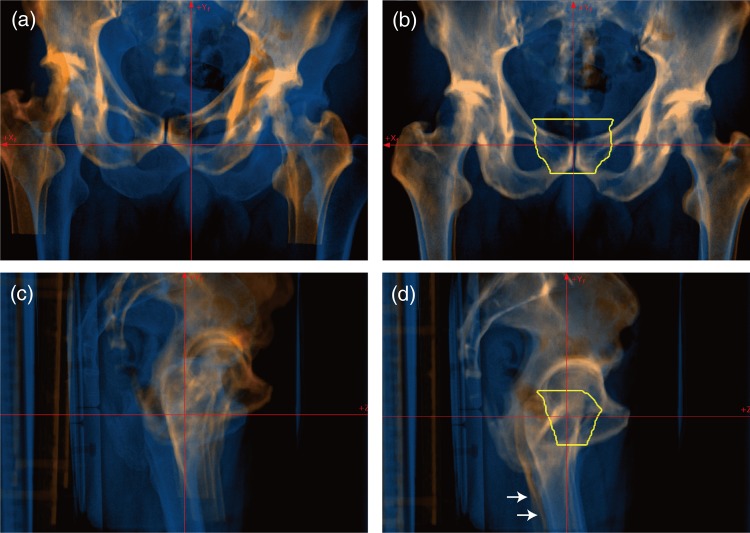
Fig. 4.
FPD images (blue layer) overlaid on DRR images (orange layer). (a) Vertical and (b) horizontal images before registration and (c) vertical and (d) horizontal images after registration for a patient with a pelvic tumor. Yellow line shows planning target volume (PTV). Registration accuracy was TRE = 0.1 mm and AE = 0.1° with ZNCC + GD. White arrows marked in lower panels are positional errors, which differ from the referenced DRR images.

