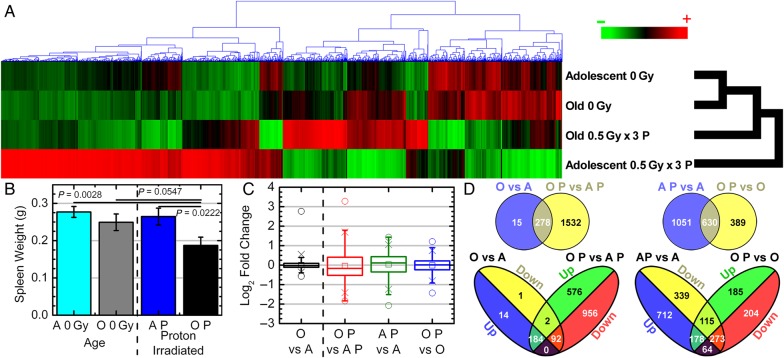
Fig. 2.
Gene regulation and physical changes for spleens as a function of host age. (A) Hierarchical clustering of genes by average linkage (UPGMA) and Euclidean distance calculation in the spleen with different age and proton irradiation for the 2374 significant genes with one-way ANOVA, FDR < 0.001. (B) Weights of spleens from C57BL/6 male mice with different age and proton irradiation comparisons (0 Gy adolescent (A) n = 20, 0 Gy old (O) n = 20, 0.5 Gy x 3 proton adolescent (AP) n = 10, 0.5 Gy x 3 proton old (OP) n = 10). (C) Average signal log2 fold-change comparing 0 Gy adolescent (A), 0 Gy old (O), 0.5 Gy x 3 proton adolescent (AP), 0.5 Gy x 3 proton old (OP) with each other. Whiskers show the range of the outliers, with max and min values as 0 and the 1 and 99th percentile outliers as X. (D) Venn diagrams of the genes with 1.2-fold change for comparisons between adolescent and old spleen samples with and without proton irradiation, with separate Venn diagrams for only the up- and downregulated genes.

