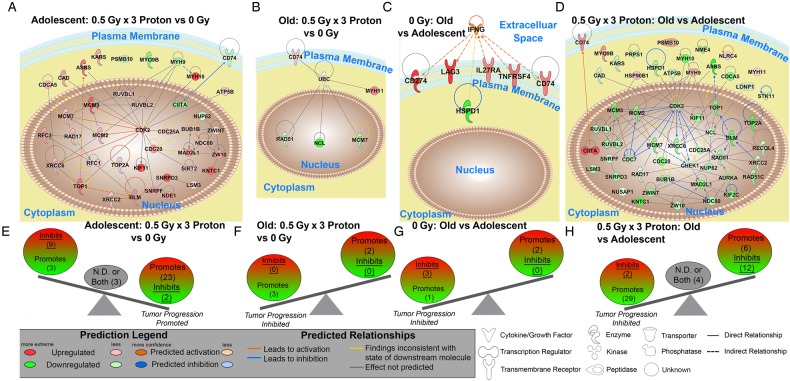
Fig. 6.
Gene network analysis for the key genes involved in splenic changes. (A–D) Pathway analysis was done with Ingenuity Pathway Analysis (IPA) software. IFNG and UBC were added to specific networks to provide relations and connections between all genes. Predicted relationships between all genes are also shown. Log2 fold changes to the gene expression were used to obtain different shades of green for regulation levels for 1.2-fold change in downregulated genes, while different shades of red depict regulation levels for 1.2-fold change in upregulated genes. The darker the shade of green or red, the greater the fold change. (E–H) A schematic of the key significant genes (Supplemental Table 4), determined to be significant in regulating many functions for each comparison, illustrating the balance between the tumor promoters and tumor suppressors with the Log2 fold change color coded as before. Genes with both promoter and suppressor effects, or the effects not determined (N.D.), are shown in the middle of the balance (gray circle and black text). The number of genes per group is indicated in parentheses.

