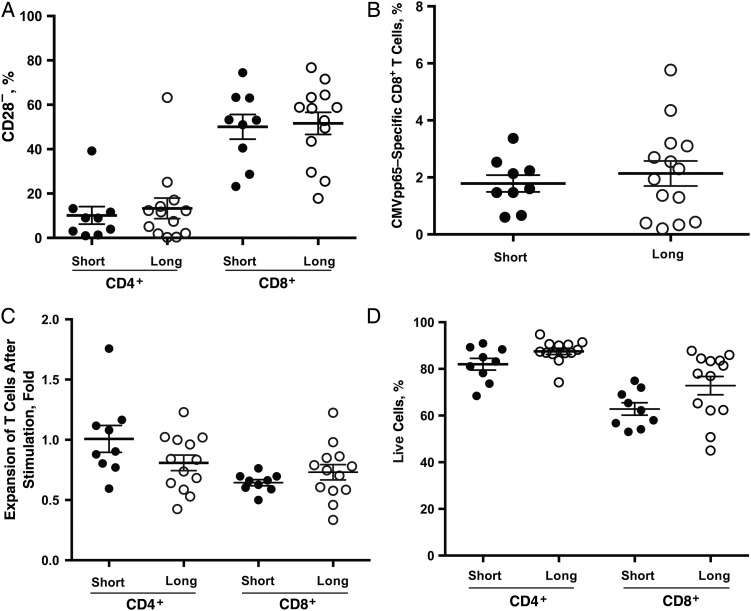
Figure 3.
Comparable general profiles of CD4+ and CD8+ T cells in short (n = 9) and long (n = 13) telomere groups. A, B, Percentages of CD28− (A) and cytomegalovirus (CMV) pp65–specific CD8+ (A) T cells in both telomere groups. CD28− and CMV pp65–specific CD8+ T cells were determined with flow cytometry, as described in “Participants, Materials, and Methods” section. C, Expansion of CD4+ and CD8+ T cells in response to anti-CD3 plus interleukin 2 (20 U/mL) for 3 days in vitro. Live cells were counted using Trypan blue dye. Each circle represents a mean of 3 visits per subject; group means (with standard error of the mean) are also shown. D, Percentages of live CD4+ and CD8+ T cells after 3-day stimulation; live cells were identified based on the fluorescence-activated cell sorting profile with forward and side scatter. Each circle represents a mean of 3 visits per subject.

