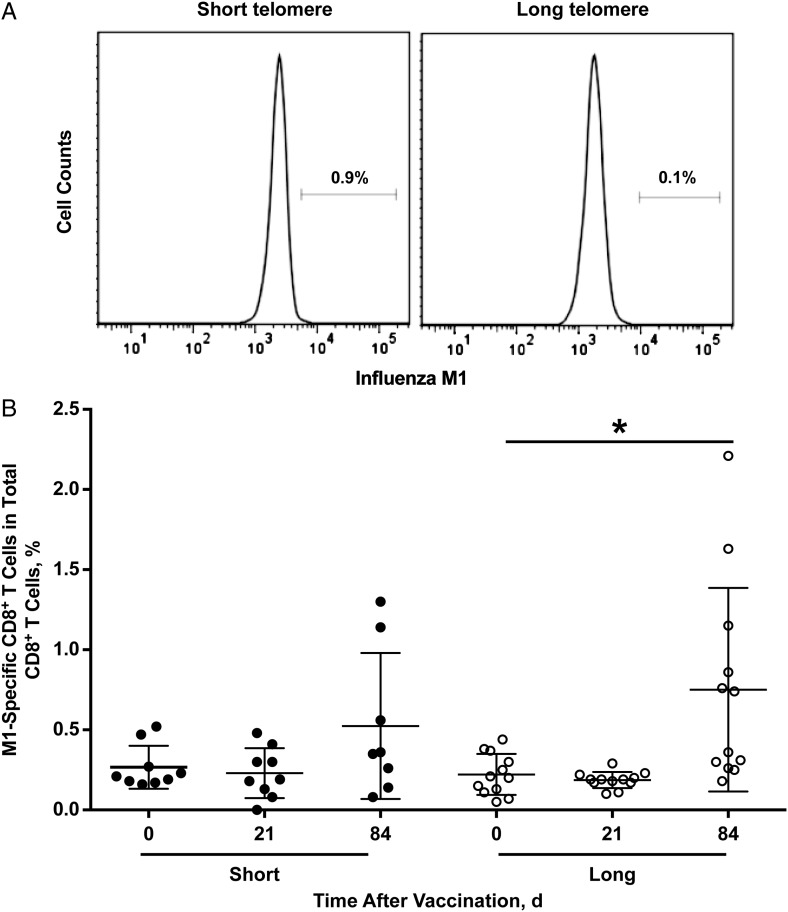
Figure 4.
Frequency and in vitro expansion of M1-specific CD8+ T cells. A, Frequency of M1-specific CD8+ T cells in short (n = 9) and long (n = 13) telomere groups, displayed as representative histograms. B, Frequency of M1-specific CD8+ T cells from participants in short and long telomere group before and after influenza vaccination. Each circle represents a single subject; group means and standard deviations are also shown. *P < .05 (day 0 vs day 84 in the long telomere group).

