Figure 5.
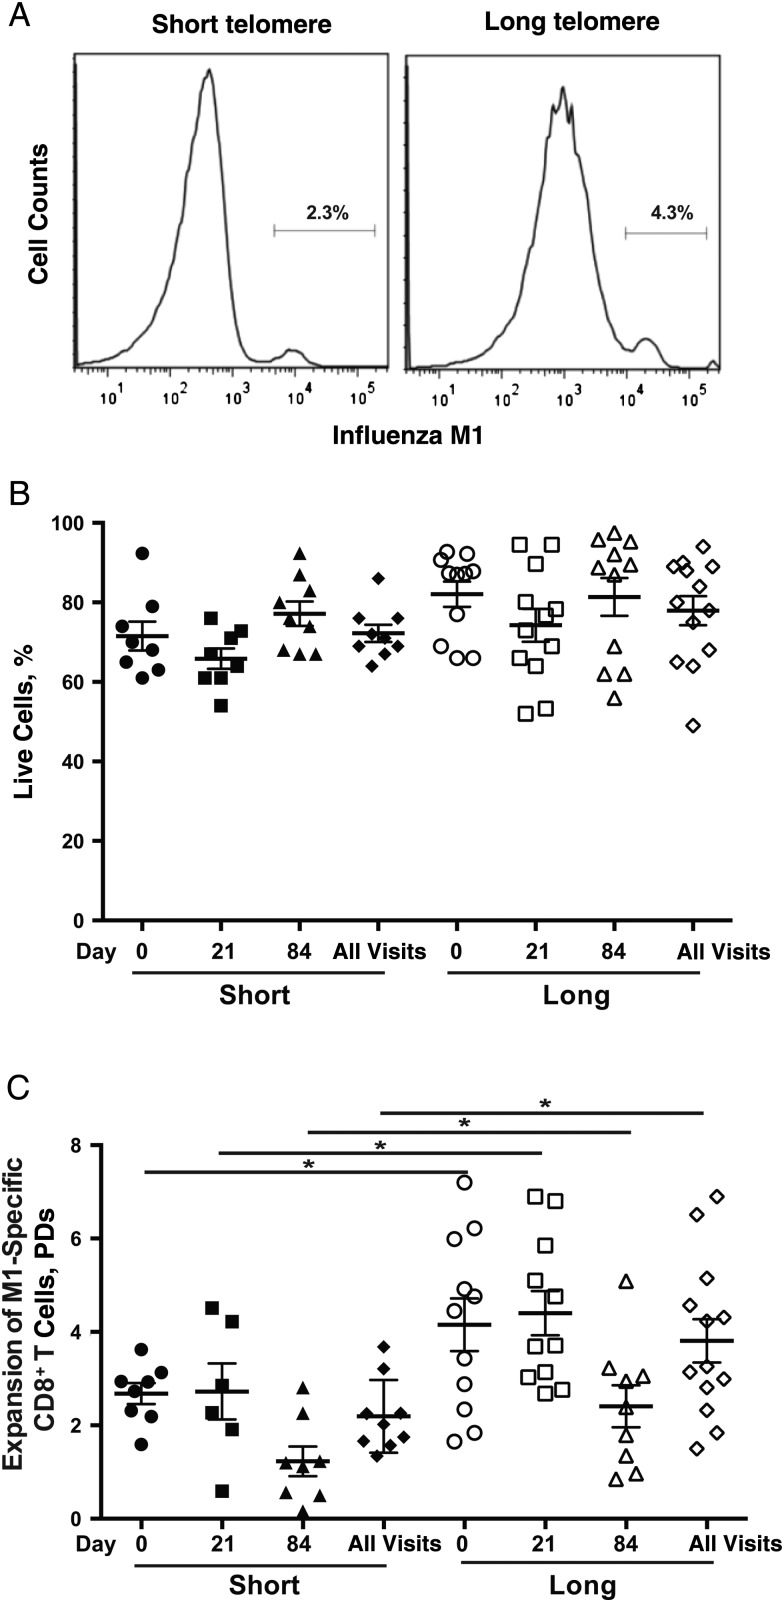
Expansion of M1-specific CD8+ T cells after in vitro stimulation. A, A representative histogram of the frequency of M1-specific CD8+ T cells after in vitro expansion in short (n = 9) and long (n = 13) telomere groups. Activation of M1-specific CD8+ T cells using monocyte-derived antigen-presenting cells (APCs), as described in “Participants, Materials, and Methods” section. B, Percentage of live M1-specific CD8+ T cells after 7-day in vitro stimulation by APCs plus M1 peptide. Circles represent results for single subjects; group means and standard errors of the mean are also shown. Live cells were identified based on the fluorescence-activated cell sorting profile with gating from forward and side scatter. C, Expansion of M1-specific CD8+ T cells after in vitro stimulation by APCs plus M1 peptide. M1-specific-CD8+ T cells were stained with M1 dextramer before and after culture and analyzed by means of flow cytometry. Population doublings (PDs) were calculated based on the live M1-specific CD8+ T cells before and after 7-day culture. Group means and standard errors of the mean are shown. *P < .05 (age adjusted).

