Figure 5.
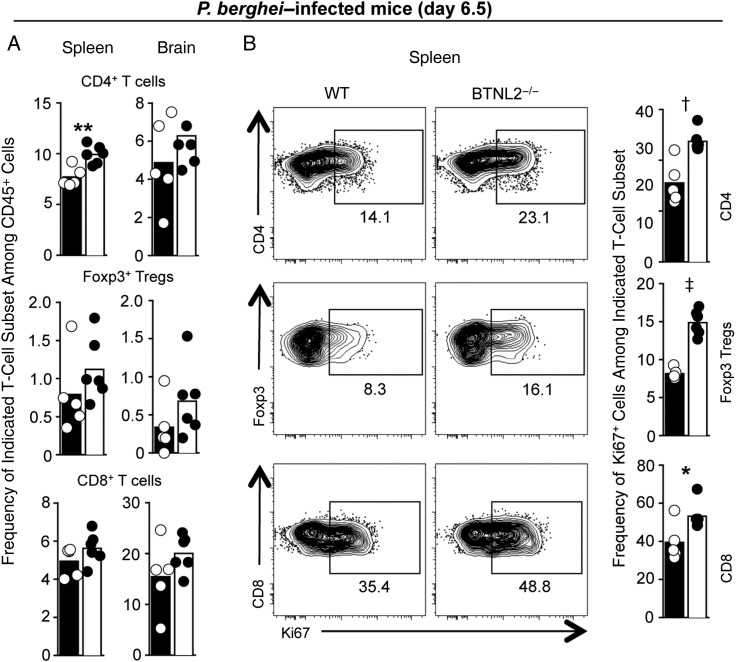
Butyrophilin-like 2–deficient (BTNL2−/−) mice exhibit increased proportion and proliferation of T cells compared with wild-type (WT) mice during experimental cerebral malaria. WT or BTNL2−/− chimeras mice were infected with 106 Plasmodium berghei ANKA–infected red blood cells. After 6.5 days, spleens and brains were harvested, stained for indicated markers and analyzed by flow cytometry. A, Frequency of indicated T-cell subsets among CD45+ hematopoietic cells in spleen and brain. B, Representative dot plots of indicated T-cell subsets (CD4, regulatory T cells [Tregs], CD8) expressing the marker of proliferation Ki67. Numbers represent the percentages of Ki67+ cells in the gate shown. In all bar graphs, dots represent individual mice, and bar shows the mean. Data represent the pool of 2 replicate experiments (n = 5–6 mice). *P < .05; †P < .01; ‡P < .0001 (unpaired t test); where values are not specified, differences are not significant.

