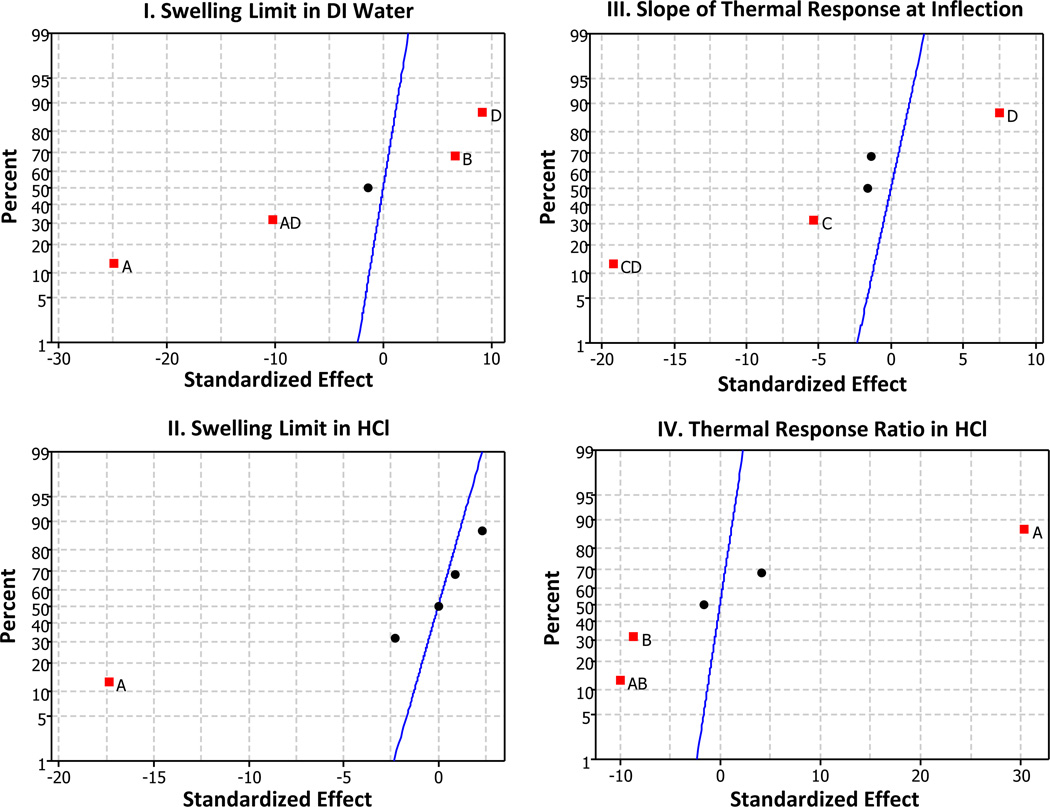
Figure 6.
Normal Plots of Standardized Effects for IPN Responses: The effects shown for each response variable are: A: C Value, B: Relative Crosslinker Concentration, C: Initiator Concentration, and D: Ionic Strength. Significant effects are shown as labeled squares. Non-significant effects are shown as unlabeled points. Position of the points indicates effect polarity. Effects to the left of the line indicate a negative effect on the response, while points to the right indicate a positive effect on the response. Confidence for effect significance is 0.95 (α = 0.05).

