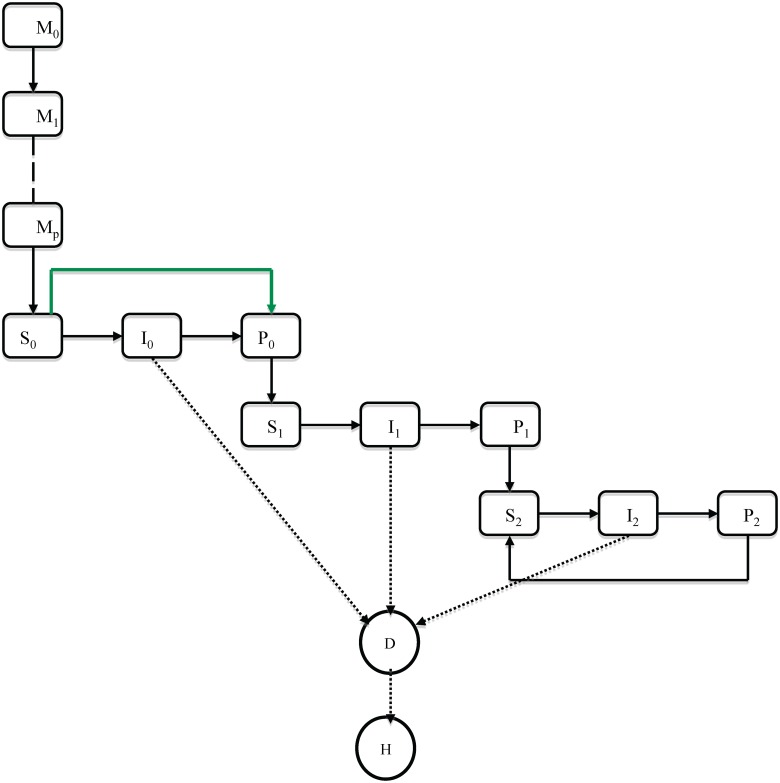
Fig 1. The model natural history framework.
Rectangles represent mutually exclusive states, solid arrows are flows between states and dotted lines show classes that contribute to the rates of disease (D) and hospitalization (H). The solid green line shows the effect of vaccination, which prevents primary infection only and otherwise has an action like primary infection.

