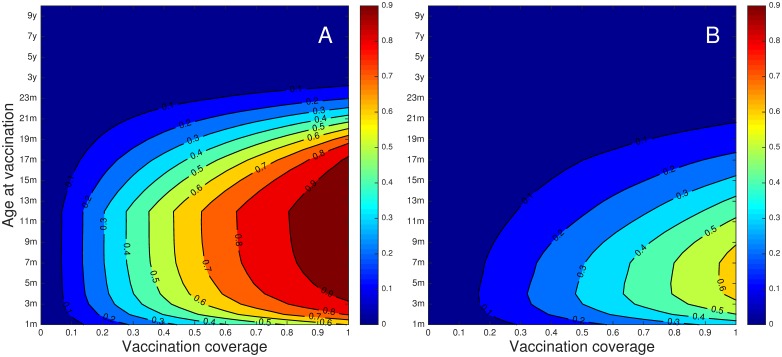
Fig 3. The effect of different ages at immunisation for different coverage with the base parameter set (Table 1) for the diary (A) and synthetic (B) contact matrices.
The contour plots show the proportions of hospitalisations prevented by immunisation at different coverage (x-axis) by age at immunisation (y-axis) calculated over a 10 year time after transients have died away. A) diary WAIFW, estimated duration in M class, 2.3m. B) synthetic mixing WAIFW, estimated duration in M class 4.0m. In A, the most hospitalisations are prevented by vaccination at ~11m, and in B at ~6m.

