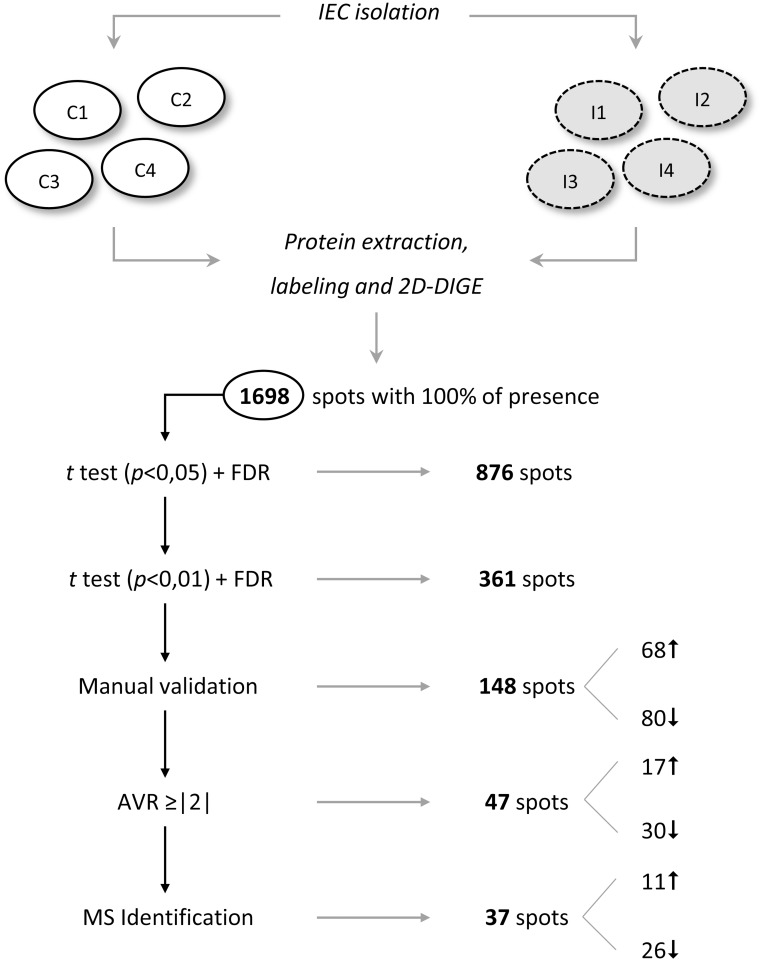
Fig 1. Schematic overview of the results obtained in the 2D-DIGE assay and the selection criteria applied.
Those spots displaying greater and most significant differential expression between the ileum of Echinostoma caproni-infected and uninfected mice were selected. FDR, false discovery rate; AVR, average volume ratio.

