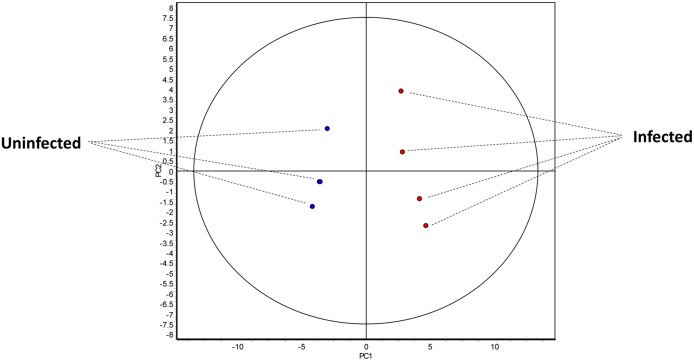
Fig 2. Multivariate statistical analysis applied to the set of 1,698 spots with 100% of presence in the 2D-DIGE experiment.
An indication about clustering and trends in protein expression profiles in the ileum of Echinostoma caproni-infected and uninfected mice is given. 2-dimensional score plot from the principal component analysis of the 8 individual biological replicates (E.caproni-infected in red and uninfected in blue).

