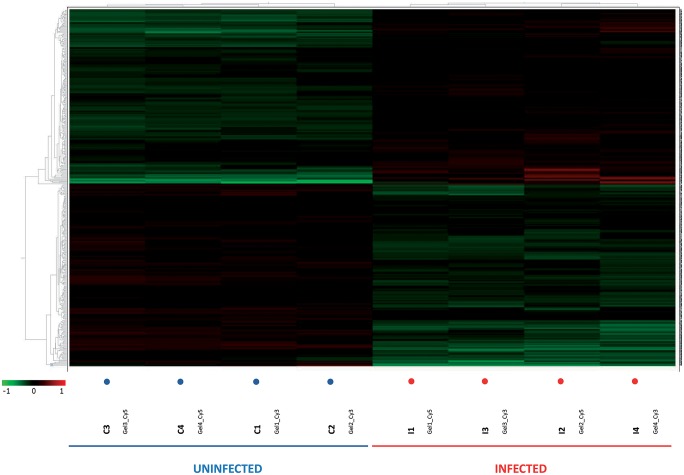
Fig 4. Heat-map with dendrograms from the hierarchical clustering analysis (Euclidean) obtained using the DeCyder extended data analysis module.
Rows represent individual proteins and columns represent the individual biological replicates indicated at the bottom of the graph. The color in each cell represents the expression using a standardized log abundance scale ranging from negative values (green) to positive values (red).

