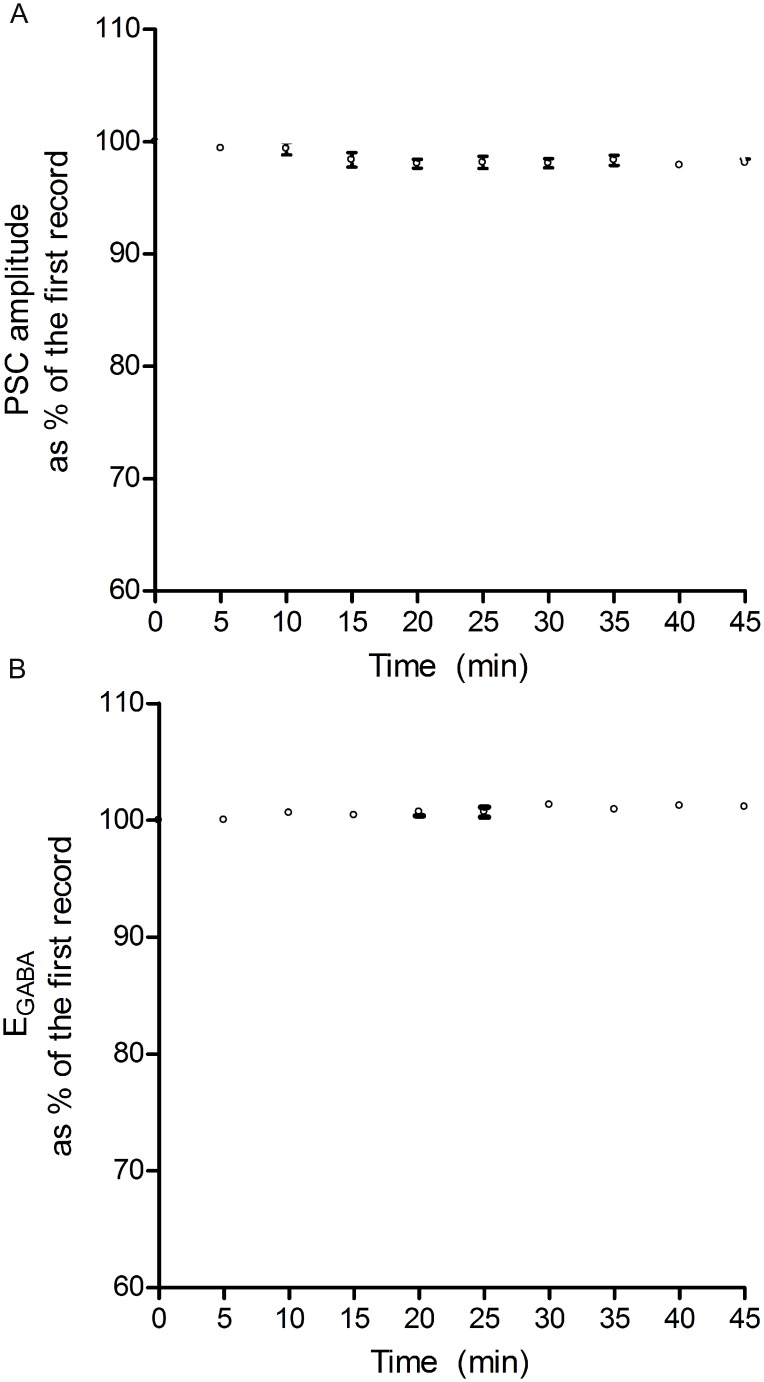
Fig 1. Stability of PSC amplitude and EGABA during control stimulation frequency (0.05 Hz).
When evoked at a low frequency (0.05 Hz), PSC amplitude and EGABA were both stable. Note that the values on the Y-axis were normalized as a percentage of control (the first record). Any deviation from the respective controls was small (less than 5%) and not statistically significant and, hence, used subsequently as a control stimulation frequency throughout the study. Data in panel A (PSC amplitude) and B (EGABA) were obtained from hippocampal CA1 neurons (n = 6) in 9–12 day old rats. Individual points on panel A and the corresponding points on B are from the same neurons. All recordings were made using the whole-cell recording method. The amplitudes plotted in panel A were taken while clamping the neurons at- 60mV.

