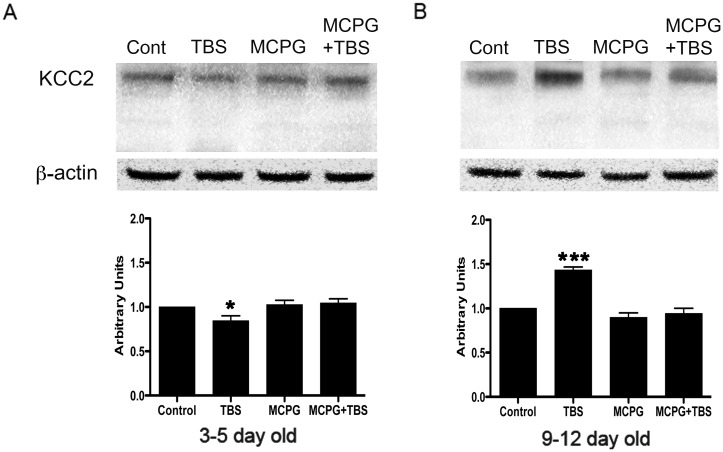
Fig 6. Western blot analysis of KCC2 in 3–5 day and 9–12 day old rat hippocampus.
Total tissue lysate (20 μg) from CA1 region of hippocampus was subjected to immunoblot analysis using KCC2 specific antibodies. KCC2 expression was detected at the expected size of 140 kDa. Note the increased expression of KCC2 following TBS in the CA1 area of 9–12 day old rat hippocampus (panel B) while decreased expression of KCC2 in that of 3–5 day old rat hippocampus (panel A). KCC2 expression was not significantly changed in MCPG and MCPG plus TBS treated slices when compared to control in both 3–5 day old (n = 5) and 9–12 day old (n = 5) rat hippocampus. β -actin as loading control and densitometric analysis are shown in middle and bottom panel, respectively. Data are presented as mean ± SD, * P<0.05,***P<0.001.

