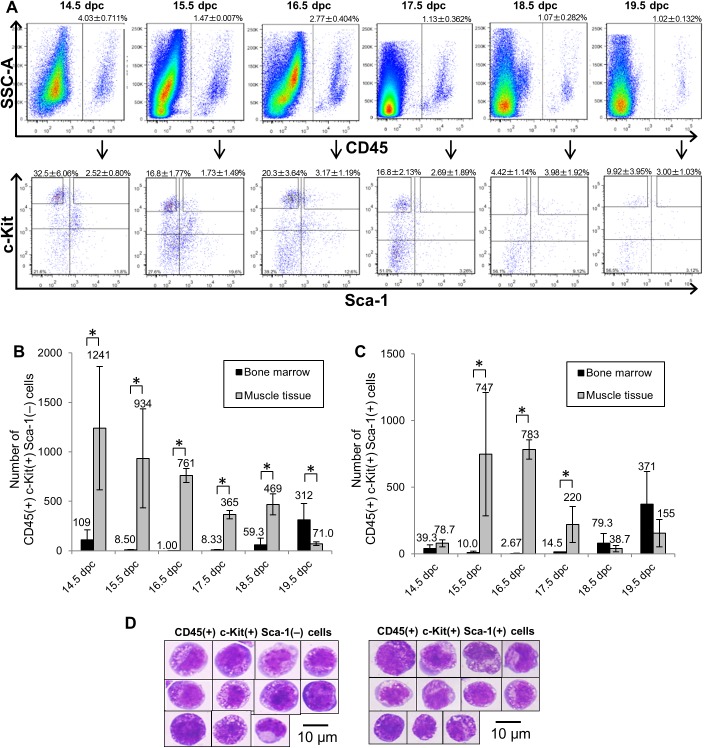
Fig 2. Flow cytometric analysis of hematopoietic cells in fetal muscle tissue.
Single cell suspensions of fetal muscle tissue surrounding both left and right femurs at stages 14.5 to 19.5 dpc, as analyzed by flow cytometry. (A) Surface phenotypes of fetal muscle cells. Among CD45(+) cells (upper panels), surface expression of Sca-1 and c-Kit was analyzed (lower panels). (B) The number of CD45(+) c-Kit(+) Sca-1(–) cells per two femurs and per two sets of femur-surrounding muscle tissue at 14.5 to 19.5 dpc. Bars represent mean values and SD of three individual experiments. (C) The number of CD45(+) c-Kit(+) Sca-1(+) cells per two femurs and per two sets of femur-surrounding muscle tissue at 14.5 to 19.5 dpc. Bars represent mean values and SD of three individual experiments. (D) Morphology of CD45(+) c-Kit(+) Sca-1(–) cells (left) and CD45(+) c-Kit(+) Sca-1(+) cells (right) from 16.5 dpc muscle. Cells are stained with May-Grünwald Giemsa solution. Scale bar represents 10 μm for all panels. *p<0.01.

