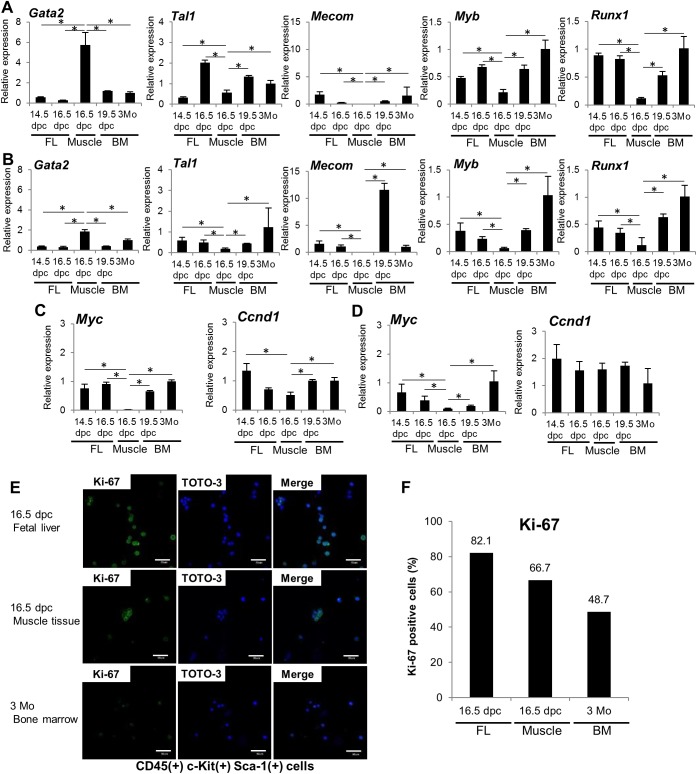
Fig 3. Expression of hematopoietic transcription factors and proliferation-related genes in muscle hematopoietic cells.
RNA was extracted from sorted 14.5 dpc and 16.5 dpc FL CD45(+) c-Kit(+) Sca-1(–) and CD45(+) c-Kit(+) Sca-1(+) cells, 16.5 dpc muscle CD45(+) c-Kit(+) Sca-1(–) F4/80(–) and CD45(+) c-Kit(+) Sca-1(+) F4/80(–) cells, 19.5 dpc fetal BM CD45(+) c-Kit(+) Sca-1(–) and CD45(+) c-Kit(+) Sca-1(+) cells, and 3-month-old adult BM Lin(–) CD34(–) c-Kit(+) Sca-1(–) and CD45(+) c-Kit(+) Sca-1(+) cells, and expression of indicated factors assessed by real-time PCR. (A) Relative expression of hematopoietic transcription factors in the CD45(+) c-Kit(+) Sca-1(–) cell population in indicated samples. Each bar represents mean value and SD of three replicates. (B) Similar analysis in the CD45(+) c-Kit(+) Sca-1(+) cell population in indicated samples. Each bar represents mean value and SD of three technical replicates. (C) Relative expression of the proliferation-related genes Myc and Ccnd1 in samples noted in (A). (D) Relative expression of proliferation-related genes in samples noted in (B). (E) Confocal images of Ki-67 in 16.5 dpc FL CD45(+) c-Kit(+) Sca-1(+) cells, 16.5 dpc muscle CD45(+) c-Kit(+) Sca-1(+) F4/80(–) cells, and 3-month-old adult BM Lin(–) CD34(–) c-Kit(+) Sca-1(+) cells. Shown is Ki-67 (green) and TOTO-3 iodide (blue) staining. Scale bar represents 50 μm for all panels. (F) The proportion of Ki-67(+) cells per total TOTO-3(+) cells in 16.5 dpc FL CD45(+) c-Kit(+) Sca-1(+) cells, 16.5 dpc muscle CD45(+) c-Kit(+) Sca-1(+) F4/80(–) cells, and 3-month-old adult BM Lin(–) CD34(–) c-Kit(+) Sca-1(+) cells. S5 Fig shows unstained Ki-67 control. *p<0.01.

