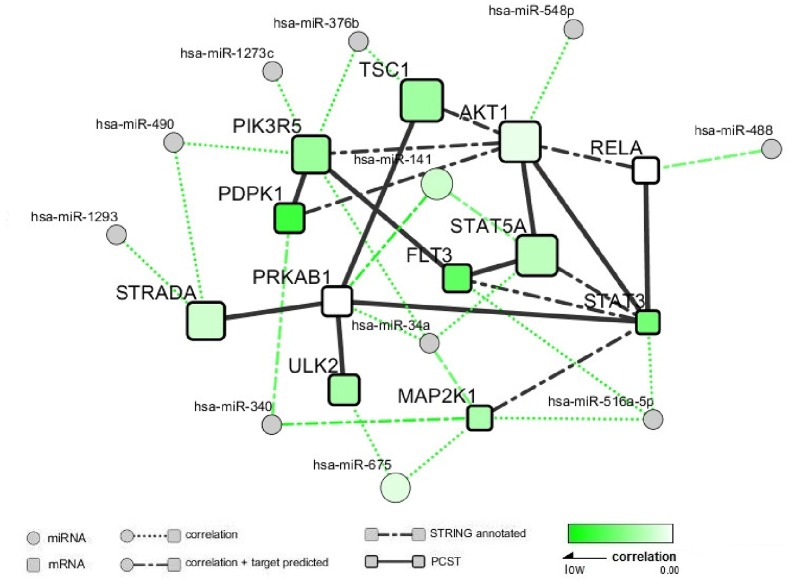
Fig 2. The interaction module inferred in network analysis.
Genes were represented by squares and connected each other with solid lines. miRNAs were represented by circles. Node size was proportional to the absolute value of the combined S score of integration analysis. Node color represented the strength of negative correlation between gene expression profile and DNA methylation level. The direct gene interactions using dot-dash lines between genes based on annotation from STRING database. Abbreviations: PCST (Prize Collecting Steiner Tree); STRING (Search Tool for the Retrieval of Interacting Genes).

