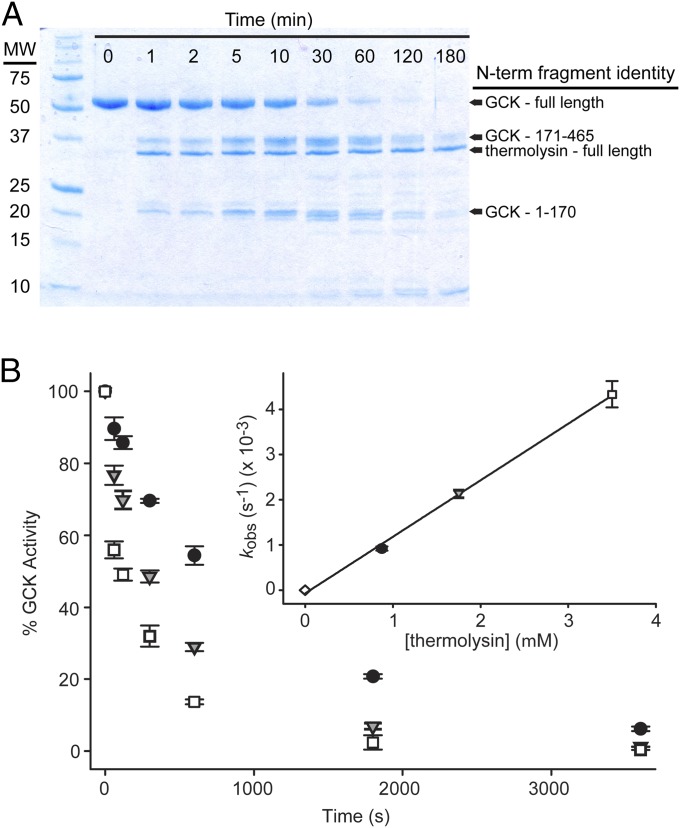
Fig. 2.
Mapping GCK intrinsic disorder via proteolysis. (A) Time course of GCK proteolysis by thermolysin monitored by SDS/PAGE. N-terminal sequencing of fragments reveals that GCK is cleaved at one site in the mobile loop between residues 170 and 171. (B) Proteolysis kinetics monitored by measuring residual GCK activity at increasing thermolysin concentrations. Curves were fitted with a single exponential decay function (error bars are ± SD) and the resulting proteolysis rates (kobs) were plotted versus thermolysin concentration to yield values for Kop (Inset; error bars are ± SE of fit).

