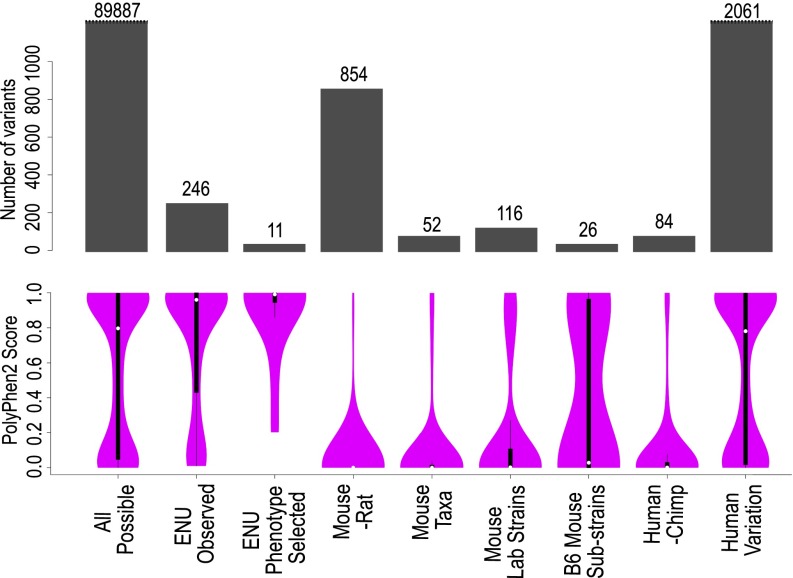
Fig. 1.
Spectrum of functional consequences predicted by PolyPhen2 for different sources of missense variants in 23 essential immune system genes. PolyPhen2 scores were calculated for the following sets of missense variants: All possible, the complete set of 89,887 possible amino acid substitutions caused by single missense changes in the 23 mouse immune system genes listed in Table 1; ENU observed, 388 mostly unphenotyped, de novo mutations found in the 23 genes by exome sequencing of 2,081 G1 mice; ENU phenotype selected, mutations in the 23 genes discovered by flow cytometric screening of thousands of G3 offspring of ENU-exposed mice; Mouse-rat, missense variants between the C57BL/6J mouse and Brown Norway rat genome sequences; Mouse taxa, missense variants between the four wild-derived, inbred strains representing Mus spretus, Mus musculus musculus, Mus musculus domesticus, and Mus musculus castaneus; Mouse Lab strains, missense variants between the genomes of 14 inbred laboratory mouse strains; B6 mouse substrains, missense variants between the genomes of inbred strains C57BL/6J and C57BL/6N; Human-Chimp, missense variants in the orthologous 23 immune genes between the reference human and chimpanzee genome; Human variation, missense variants in the same immune genes detected by population-scale human exome sequencing (36). The barplots in gray indicate the number of variants present in each set. Purple violin plots are kernel density plots representing the distribution of PolyPhen2 scores for each variant set. The white dot indicates the median PolyPhen2 value for each set. The black bars are box-and-whisker plots: thick black bar extends from the first to the third quartile; thin black lines extend to the lowest and highest data points within 1.5 times the interquartile range.

