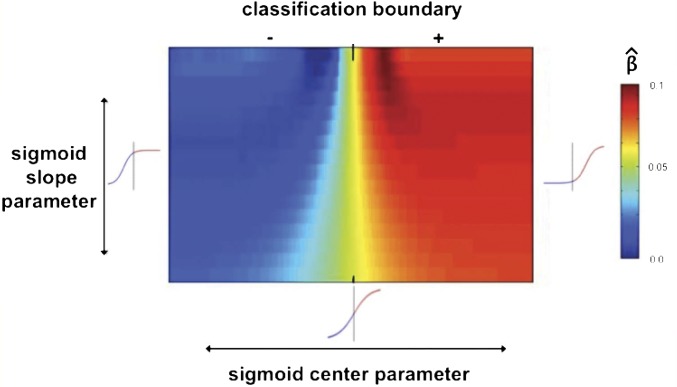
Fig. S3.
Heat map visualizing variation in the prediction of amygdala activity as a function of different sigmoidal transformations of the signed distance of an observation from the lmSTC classification boundary. Colors correspond to different β values for this regression averaged across 16 cross-validation iterations. The x axis represents different values of the sigmoid’s “center.” The y axis represents different slopes, with steeper slopes located at the top of the graph. Together, these two parameters yield different shapes, three of which are shown at the appropriate locations in the space for reference. Vertical bars through the reference sigmoids correspond to the location of the classification boundary, as does the bar at the top along the x axis. The “+” signifies the positive side of the classification hyperplane (the “grandfather kicked the baby” side), whereas the “−” signifies that negative side of the hyperplane. We see better prediction when the sigmoid is centered at or to the right of the hyperplane. The best prediction is obtained by a function with a steep slope, centered slightly to the right of the hyperplane. (See Fig. 1B.) This demonstrates that patterns corresponding to “the grandfather kicked the baby” are more likely to elicit an amygdala response than their mirror image, as explained in the main text. However, the rightward shift of the best sigmoid, past the classification boundary, also suggests that the likelihood of no amygdala response, given the “grandfather kicked the baby” pattern in lmSTC was greater than the likelihood of an amygdala response, given the “baby kicked the grandfather” pattern. More generally, this demonstrates that the point of indifference for classification need not coincide with the point of indifference for predicting a response elsewhere in the brain. This approach may be useful for empirically testing subtly different quantitative functions relating information in one brain area to information or activation in other.

