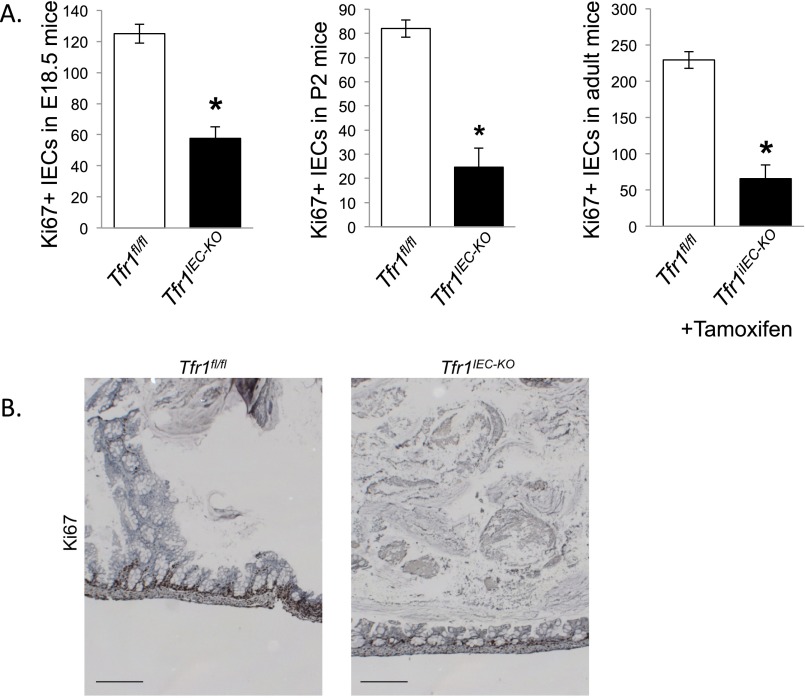
Fig. S3.
Ki67 staining (supplemental to Figs. 1F and 2B). (A) Ki67+ IECs were counted in five fields from 3 Tfr1fl/fl and Tfr1IEC-KO mice at E18.5 and P2 and from three Tfr1fl/fl and Tfr1iIEC-KO tamoxifen treated 2-mo-old mice. Ages are shown on the y axis. *P < 0.005 by Student’s t test. Values represent mean ± SEM. (B) The figure shows general morphological changes and decreased Ki67 staining in colonic crypts in Tfr1IEC-KO mice. (Scale bars, 200 μM.)

