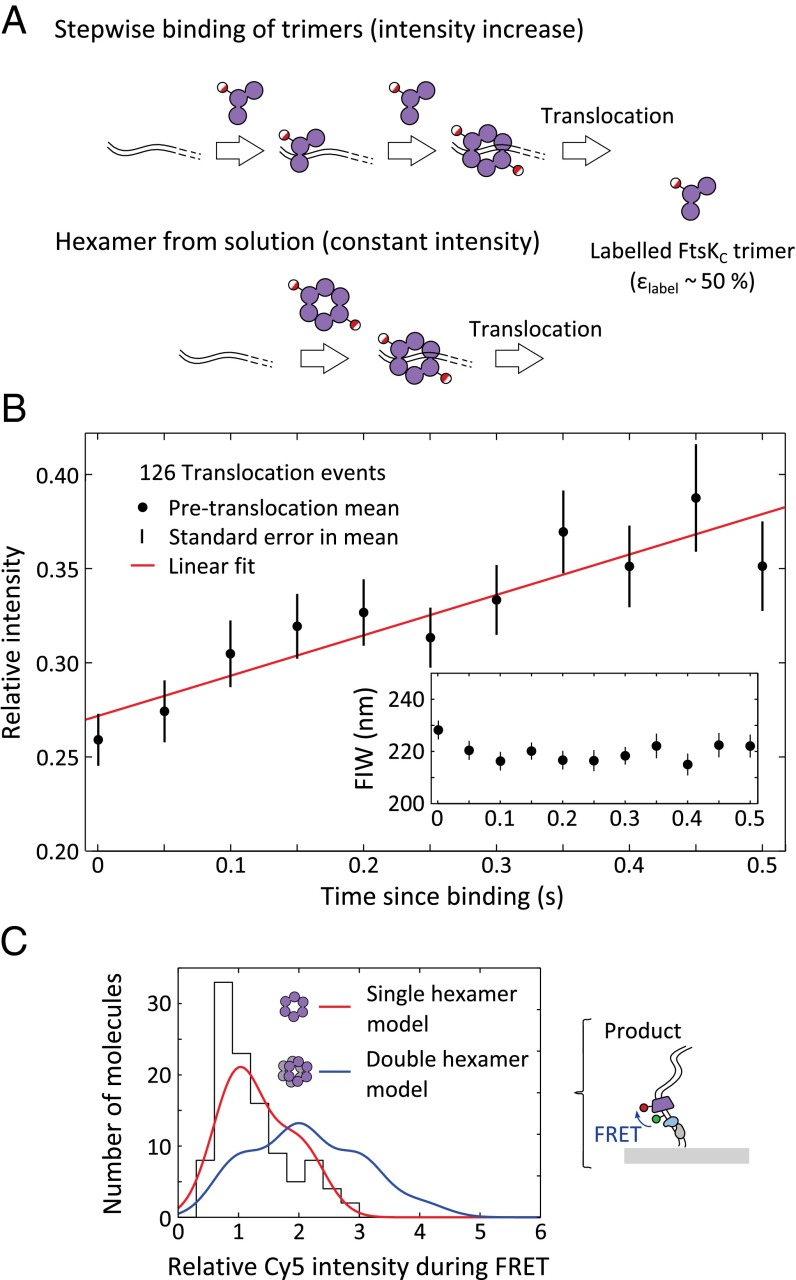
Fig. 3.
FtsKC stoichiometry. (A) Intensity changes before translocation. If FtsKC assembles in a stepwise fashion before translocation, we expect an increase in intensity before translocation starts, whereas if fully assembled oligomers in solution bind and translocate, there would be no increase. (B) Mean relative intensity before translocation. A single Cy5 had a relative intensity of 0.2–0.4 between 2 and 3 kb along the DNA (Methods). Error bars: ±SEM. Least-squares fit (red) with an intensity increase of 38.5 ± 0.2% in the 0.5 s since binding (by which time more than 66% of translocations have begun). (Inset) Mean FIW for the same molecules. (C) Cy5 intensity during FRET. (Right) Corrected intensity during FRET events for the product DNA conformation were extracted and histogrammed (n = 108). (Left) Predicted intensity distribution is shown for a single hexamer (red) and a double hexamer (blue) of FtsKC. A single hexamer provides a better explanation of our data [single hexamer: sum of squared deviation (SSD) = 330; double hexamer: SSD = 1,230].

