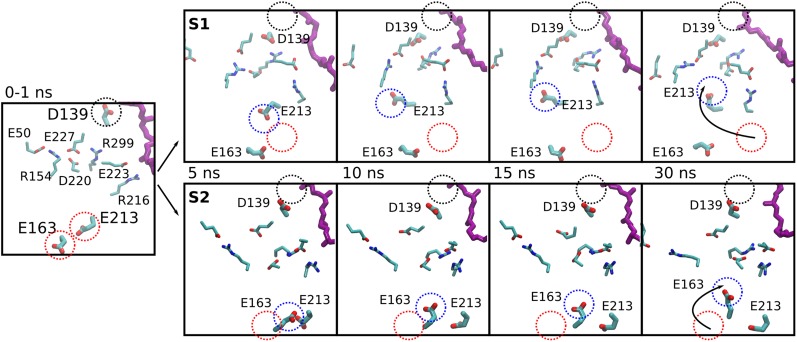
Fig. 6.
E-quartet and Q-site coupling. Simulation snapshots highlighting the long-range conformational transitions in complex I. Simulation snapshots are taken at 0–1, 5, 10, 15, and 30 ns from the 100-ns simulations (systems S1, Top; S2, Bottom) of the QH2 state. The initial position of Asp-139 is marked with a black dotted circle. Initial crystallographic positions and relaxed MD positions of Glu-213/Glu-163 are marked with red and blue dotted circles, respectively.

