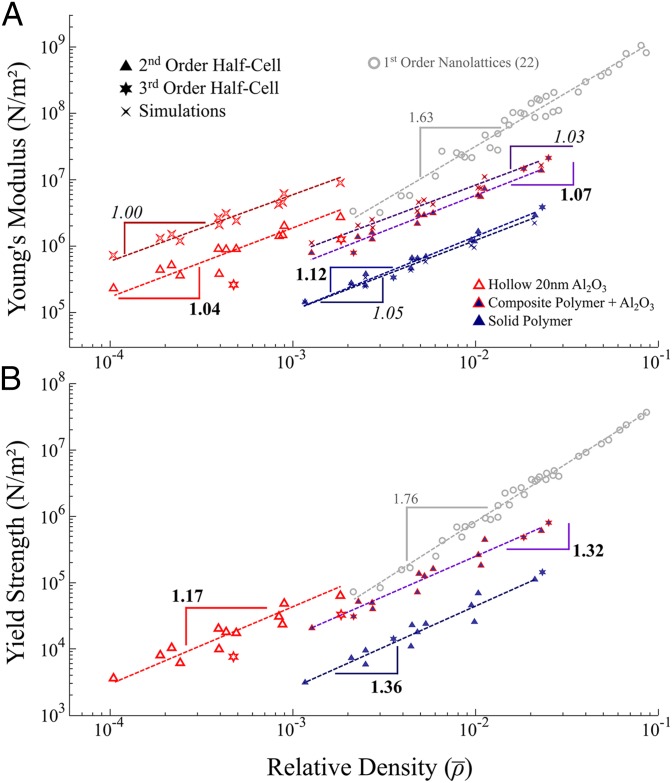
Fig. 5.
Comprehensive data plot of all tested hierarchical nanolattices. (A) Effective Young’s modulus of the hierarchical structures plotted against their relative density. Data are plotted for experimental (slope values are in bold) and refined node simulations (slope values are italicized) results. (B) Experimentally derived effective yield strength of the hierarchical nanolattices plotted against their relative density.

