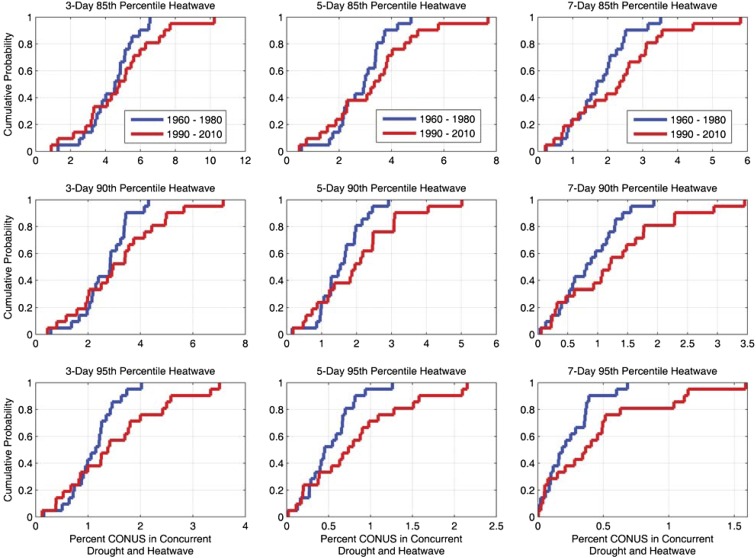
Fig. 2.
The empirical CDF of drought and heatwave concurrences from 1960 to 1980 (blue) and 1990 to 2010 (red). The x axes represent the percent (%) of CONUS in concurrent drought and heatwave (see SI Data Sources and Processing for more information on percent of CONUS). The rows change in heatwave severity (85th percentile, 90th percentile, and 95th percentile), and the columns change in heatwave duration (3 d, 5 d, and 7 d).

