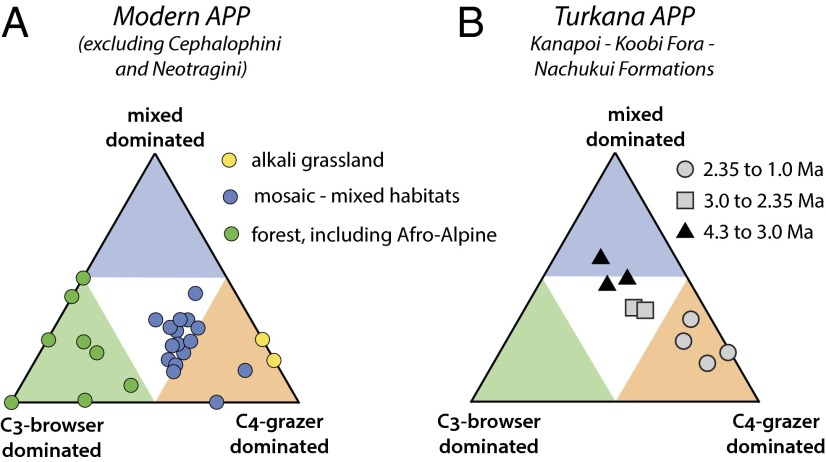
Fig. 3.
Ternary diagram showing proportions of C3 browsers, C3–C4 mixed feeders, and C4 grazers from the orders Artiodactyla, Perrisodactyla, and Proboscidea (APP); each taxon in each locality or time interval is represented by the average δ13C for that taxon. Each point in the figure represents the respective proportions of APP taxa that are C3 browsers, C3–C4 mixed feeders, or C4 grazers at one modern locality, or one fossil assemblage from the Turkana Basin of a specific age range. The green, blue, and orange triangles represent regions where >50% of the taxa are C3 browsers, C3–C4 mixed feeders, or C4 grazers, respectively. (A) Modern ecosystems as described in SI Appendix, Table S1, using data from Dataset S1; Neotragini and Cephalophini are excluded for comparison with fossil assemblages (see SI Appendix, Fig. S3 for comparison with, and without, inclusion of Neotragini and Cephalophini). (B) Fossil assemblages for age ranges discussed in this paper from the Kanapoi, Nachukui, and Koobi Fora Formations; data from Dataset S2.

