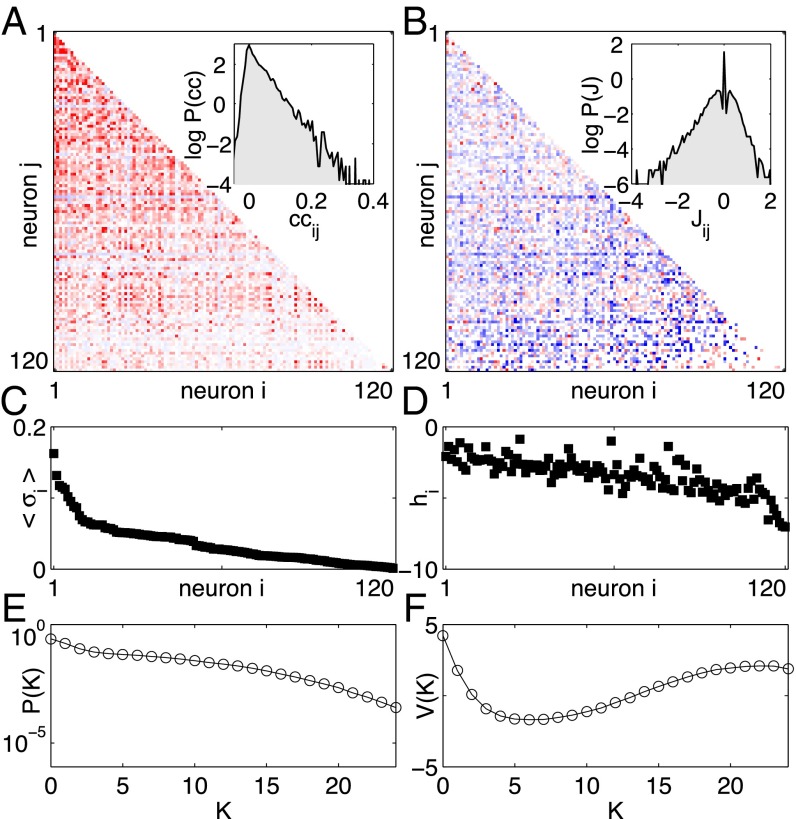
Fig. 2.
Maximum entropy models for retinal activity in response to natural movies (11). (A) The correlation coefficients between pairs of neurons (red, positive; blue, negative) for a 120-neuron subnetwork. Inset shows the distribution of the correlation coefficients over the population. (B) The pairwise coupling matrix of the inferred model, from Eq. 4. Inset shows the distribution of these pairwise couplings across all pairs . (C) The average probability of spiking per time bin for all neurons (sorted). (D) The corresponding bias terms in Eq. 4. (E) The probability that K out of the N neurons spike in the same time bin. (F) The corresponding global potential in Eq. 4. Notice that A, C, and E describe the statistical properties observed for these neurons, whereas B, D, and F describe parameters of the maximum entropy model that reproduces these data within experimental errors.

