
Fig. 3.
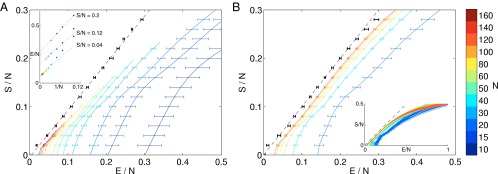
Entropy vs. energy. (A) Computed directly from the data. Different colors show results for different numbers of neurons; in each case, we choose 1,000 groups of size N at random, and points are means with SDs over groups. Inset shows extrapolations of the energy per neuron at fixed entropy per neuron, summarized as black points with error bars in the main plot. Dashed line is the best linear fit to the extrapolated points, . (B) Computed from the maximum entropy models. We choose neurons out of the population from which we record, and, for each of these subnetworks, we construct maximum entropy models as in Eq. 4; for details of the entropy calculation, see Supporting Information. Inset shows results for many subnetworks, and the main plot shows means and SDs across the different groups of N neurons. Black points with error bars are an extrapolation to infinite N, as in A, and the dashed line is .