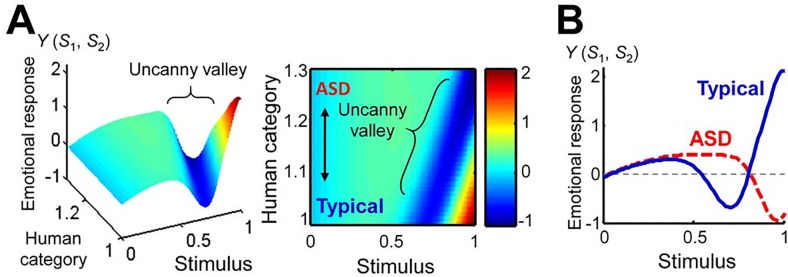
Fig 4. Predictions of the uncanny valley effects according to Moore’s model.

(A) Emotional response plotted as a function of the stimulus and the mean of the human category. The left- and right-hand panels show the three-dimensional representation, and the color image of a plain face, respectively. (B) The uncanny valley curves for the typical and ASD conditions (typical, μ c2 = 1; ASD, μ c2 = 1.25).
