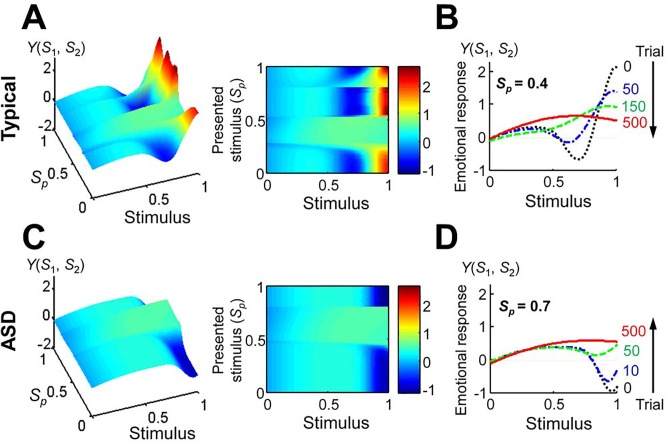
Fig 6. Effects of robot-assisted therapy on emotional response.
(A) Emotional response in the typical condition plotted as a function of the stimulus and presented stimulus. The left and right panels correspond to the three-dimensional representation, and a color image of a plain face, respectively. (B) Example of the uncanny valley curve changes in the typical condition for 0.4 of the presented stimulus at 0, 50, 150, and 500 trials. (C) Emotional response in the ASD condition plotted as a function of the stimulus and presented stimulus. The left and right panels correspond to the three-dimensional representation, and a color image of a plain face, respectively. (D) Example of the uncanny curve changes in the ASD condition for 0.7 of the presented stimulus at 0, 10, 50, and 500 trials.

