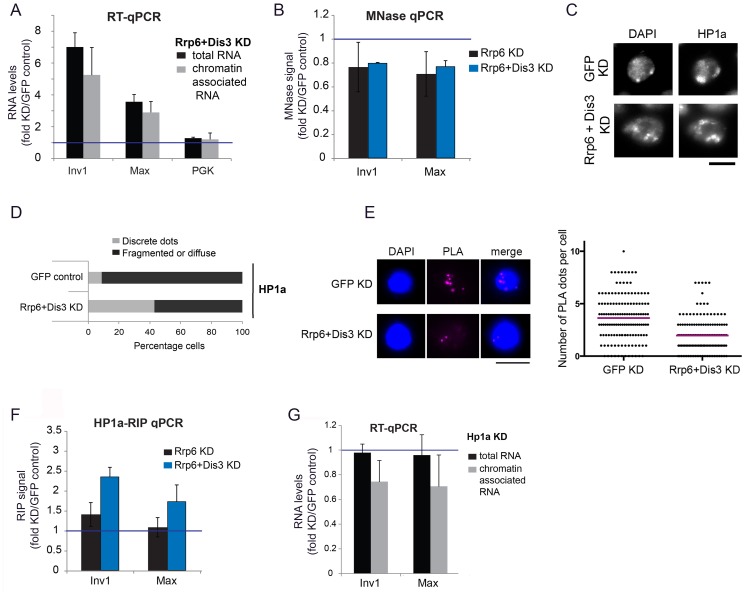
Fig 4. Depletion of exosome ribonucleases alters the compaction of the heterochromatin and increases the levels of heterochromatin-associated transcripts.
(A) S2 cells were depleted of RRP6 and DIS3. Total RNA levels and chromatin-associated RNA levels were calculated for two selected heterochromatin sequences and a protein-coding gene (Pgk) as control. The data was normalized to actin 5C and expressed as a fold change relative to the GFP control. The histogram shows averages and standard deviations of three independent biological replicates. (B) MNase assays were carried out in S2 cells depleted of RRP6 or depleted of both RRP6 and DIS3. The digested chromatin was quantified by qPRC and compared to the corresponding chromatin in undigested samples. The values were normalized to a nucleosome-free region in the Hsp70 promoter (Petesch and Lis, 2008). The histogram shows the average values expressed as a fold change relative to the GFP control (blue line) calculated from four (for RRP6 KD) and two (for RRP6+DIS3 KD) independent biological replicates, respectively. The error bars represent standard deviations. (C) IF analysis of S2 cells after knock-down of RRP6 and DIS3. The figure shows examples of cells stained with antibodies against HP1a and counterstained with DAPI. The bar represents 5 μm. (D) Quantification of chromatin patterns in cells stained as in C. Cells were classified as either showing few discrete fluorescent dots, or fragmented or diffuse staining. The stacked bars show the percentage of cells in each class. (E) PLA analysis with antibodies against HP1a and histone H3 were carried out in S2 cells depleted of both RRP6 and DIS3, and in control cells treated in parallel with GFP-dsRNA. The images show examples of PLA staining (magenta) in cells counterstained with DAPI (blue). The graph shows the number of PLA dots per cell in each condition. The mean number of dots per cell (magenta line) was 3,63 in GFP control cells and 1,96 in cells depleted of Rrp6 and Dis3. The difference was highly significant (P<0.0001; two-tailed Mann Whitney test; n = 140 cells analyzed in each condition, from two independent experiments). (F) RIP experiments with an antibody against HP1a were performed to quantify the binding of HP1a with chromatin-bound RNAs derived from selected heterochromatic regions in control cells and in cells depleted of RRP6 and DIS3. The RIP signals of the knockdowns are expressed as fold changes relative to the GFP control samples (blue line). Averages and standard deviations from two biological replicates, each with two technical replicates, are presented. Note that the signals of the GFP samples were near background levels (S8 Fig). (G) S2 cells depleted of HP1a were analysed as in A. The data was normalised to actin 5C. Averages and standard deviations of three independent biological replicates are presented in the histogram.

