
Figure 2.
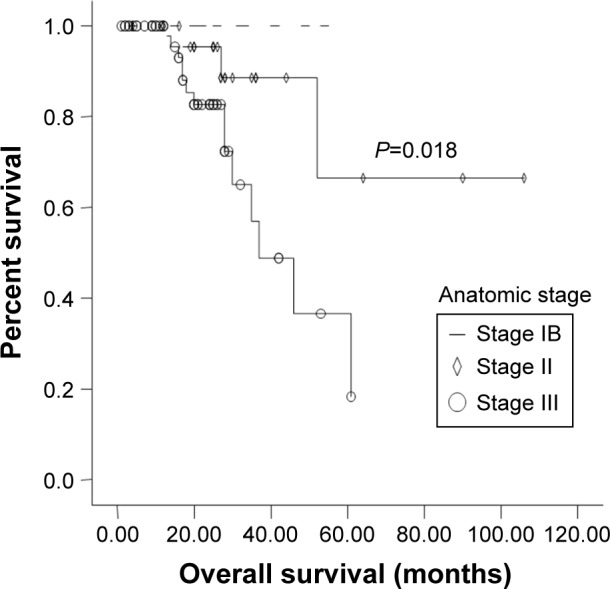
Kaplan-Meier graph of overall survival (OS) for patients at stage IB, II and III.
Note: The dotted line was the survival curve of patients with stage IB.
Official websites use .gov
A
.gov website belongs to an official
government organization in the United States.
Secure .gov websites use HTTPS
A lock (
) or https:// means you've safely
connected to the .gov website. Share sensitive
information only on official, secure websites.
Kaplan-Meier graph of overall survival (OS) for patients at stage IB, II and III.
Note: The dotted line was the survival curve of patients with stage IB.