. 2015 Jul 31;48(7):413–418. doi: 10.5483/BMBRep.2015.48.7.036

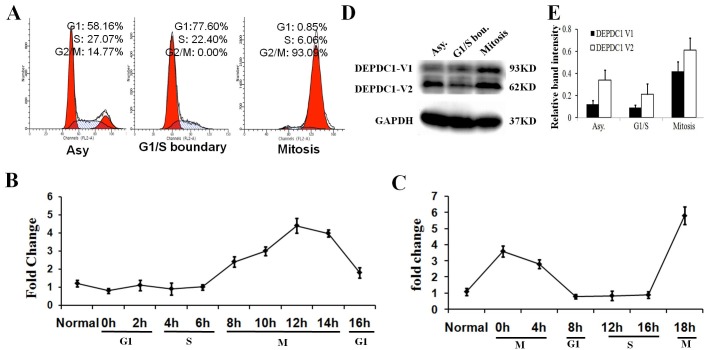
Fig. 1. DEPDC1 is highly expressed in mitosis. (A) Cell synchronization. HeLa cells were unsynchronized or synchronized at the G1/S boundary by using a double-thymidine block or in mitosis with a thymidine-nocodazole block. Cell cycle profile was determined by FACS analysis. (B) DEPDC1 mRNA expression after double-thymidine block release. HeLa cells were synchronized at the G1/S boundary by using a double-thymidine block. At the indicated time points following release from the second thymidine block, total RNA was prepared and subjected to quantitative RT-PCR. (C) DEPDC1 mRNA expression after thymidine-nocodazole block release. HeLa cells were synchronized in mitosis by using a thymidine-nocodazole block. At the indicated time points following release from the nocodazole block, total RNA was prepared and subjected to quantitative RT-PCR. (D) DEPDC1 protein is highly expressed in mitosis. Whole cell lysates were prepared from unsynchronized or synchronized HeLa cells and subjected to immunoblotting. (E) Western blot quantification. Intensity of individual bands was quantified using Quantity One software (Bio-Rad, Version 4.3.1), and expressed relative to GAPDH signal as a measure of protein relative abundance in the different samples.

Fig. 1.