. 2015 Jul 31;48(7):413–418. doi: 10.5483/BMBRep.2015.48.7.036

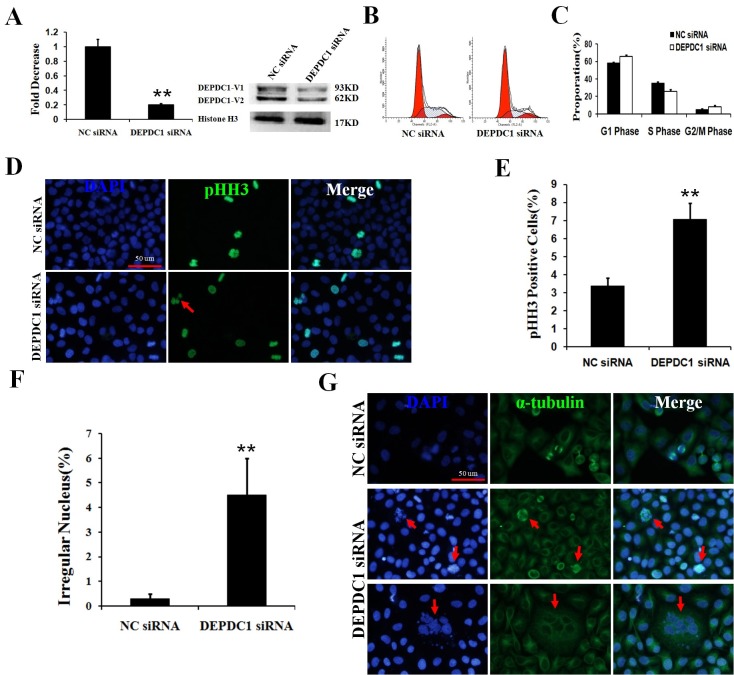
Fig. 3. Knockdown of DEPDC1 induces mitotic arrest and defects. (A) siRNA-mediated silencing of DEPDC1. HeLa cells were transiently transfected with a negative control siRNA (NC siRNA) or with siRNA against DEPDC1. Forty-eight hours after transfection, total RNA and whole cell lysates were prepared and subjected to RT-PCR (left) and immunoblotting (right), respectively. (B) The effects of DEPDC1 depletion on cell cycle profile. HeLa cells were transiently transfected as in (A). Forty-eight hours after transfection, cells were harvested, fixed in ethanol, stained with propidium iodide (PI) and subsequently subjected to FACS analysis. Representative histograms of cell cycle analysis are shown. (C) Statistical analysis of percentage of cells with G1, S or G2/M DNA content that correspond with data in (B) are shown. (D) Knockdown of DEPDC1 causes mitotic arrest and defects. Exponentially growing HeLa cells were transiently transfected with the indicated siRNAs. Forty-eight hours after transfection, cells were fixed and stained with anti-phospho-histone H3 antibody (green). DAPI was used to stain cell nuclei (blue). Red arrow indicates cells with irregular nucleus. Scale bar, 50 μm. (E) and (F) Statistical analysis of percentage of phospho-histone H3 positive cells and cells with irregular nuclei that correspond with data in (D) are shown. (G) Knockdown of DEPDC1 causes mitotic defects. HeLa cells were transiently transfected with the indicated siRNAs. Forty-eight hours after transfection, cells were fixed and stained with anti-α-tubulin antibody (green). DAPI was used to stain cell nuclei (blue). Red arrow indicates cells with abnormal multipolar spindle structure. Note that the different cell sizes and numbers are due to the uneven cell distribution of cell seeding. Scale bar, 50 μm.

Fig. 3.