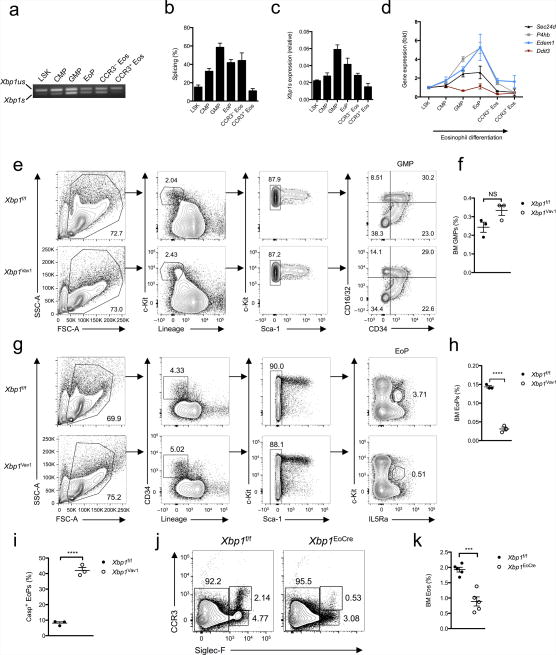
Figure 2.
XBP1 is potently activated during eosinophil differentiation in vivo and is required upon commitment to the eosinophil lineage. (a) PCR analysis of spliced (Xbp1s) and unspliced (Xbp1us) Xbp1 mRNA in LSK cells, CMPs, GMPs, EoPs and CCR3− or CCR3+ eosinophils purified by flow cytometry. (b) Frequency of Xbp1s mRNA among total Xbp1 mRNA in sorted LSK cells, CMPs, GMPs, EoPs, CCR3− eosinophils, and CCR3+ eosinophils (n = 3 mice per cell type). (c) Quantitative PCR analysis of the Xbp1s isoform in cells as in a (n = 3 mice per cell type); results were normalized to those of Actb. (d) Quantitative PCR analysis of Sec24d, P4hb, Edem1 and Ddit3 in cells as in a (n = 3 mice per cell type); results (normalized as in c) are presented relative to those of LSK cells. (e) Gating strategy for flow cytometry of bone marrow GMPs from Xbp1f/f and Xbp1Vav1 mice. Numbers adjacent to outlined areas indicate percent cells with leukocyte side scatter (SSC-A) or forward scatter (FSC-A) (far left), c-Kit+Lin− cells (middle left) or c-Kit+Sca-1− cells (middle right); numbers in quadrants indicate percent GMPs in each (far right). (f) Frequency of GMPs in the bone marrow of Xbp1f/f and Xbp1Vav1 mice (n = 3 per genotype). (g) Gating strategy for flow cytometry of bone marrow EoPs from Xbp1f/f and Xbp1Vav1 mice. Numbers adjacent to outlined areas indicate percent cells with leukocyte side or forward scatter (far left), CD34+Lin− cells (middle left), c-Kitpos–negSca-1− cells (middle right) or c-KitintIL-5Rα+ cells (far right). (h) Frequency of EoPs in bone marrow from Xbp1f/f and Xbp1Vav1 mice (n = 3 per genotype). (i) Frequency of EoPs exhibiting caspase activity (Casp+), assessed by flow cytometry (n = 3 mice per genotype). (j) Flow cytometry of eosinophils in bone marrow from Xbp1f/f and Xbp1eoCRE mice. Numbers adjacent to outlined areas indicate percent CCR3pos–negSiglec-F− cells (left), CCR3+Siglec-F+ cells (top right) or CCR3−Siglec-F+ cells (bottom right). (k) Frequency of eosinophils in bone marrow from Xbp1f/f and Xbp1eoCRE mice (n = 5 mice per genotype). Each symbol (f,h,i,k) represents an individual mouse; small horizontal lines indicate the mean (± s.e.m.). NS, not significant (P > 0.05); *P < 0.001 and **P < 0.0001 (Student’s t-test). Data are from one experiment representative of three experiments with more than three independent biological replicates (a) or are representative of at least three independent experiments with at least three mice per group in each (b–k; mean and s.e.m. in b–d,f,h,i,k).

