Figure 6.
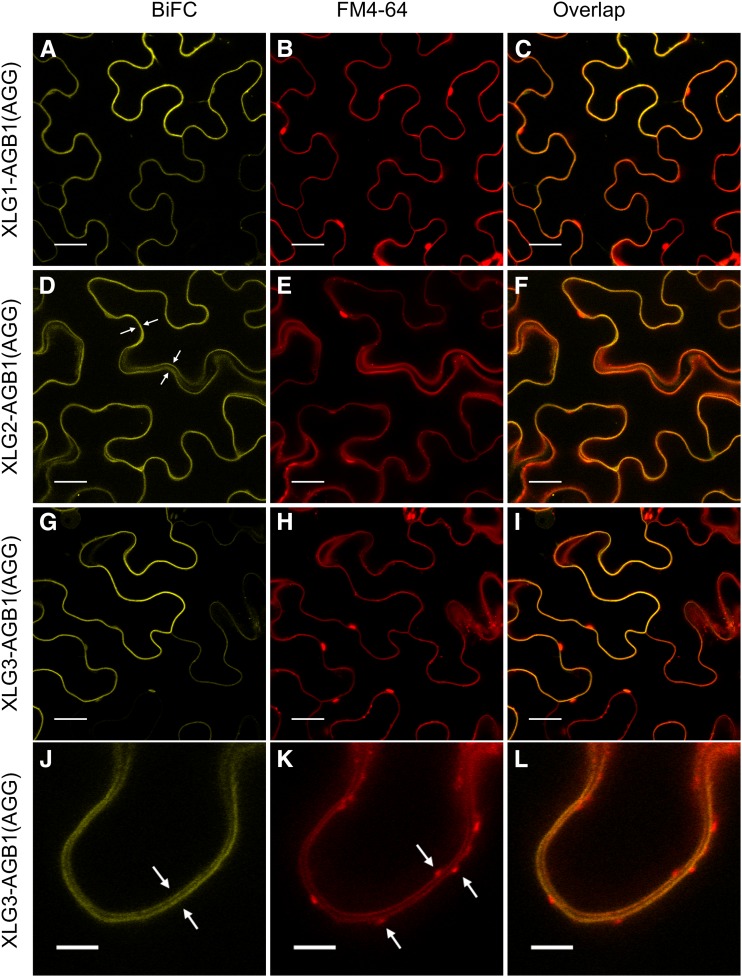
XLG-based heterotrimers localize specifically to FM4-64-marked plasma membranes. The UBIQUITIN10 promoter-driven XLG-AGB1 test constructs were cotransformed with the 35S-driven pDOE-γ1γ2 vector (Gookin and Assmann, 2014) as a source of untagged AGG1 and AGG2. A, XLG1 interacts with AGB1. B, FM4-64 stains the plasma membrane. C, XLG1-AGB1 BiFC signal overlaps with the FM4-64-marked plasma membrane. D, XLG2 interacts with AGB1. The four white arrows mark the plasma membranes of two adjacent transformed cells traversing in and out of the 1.1-μm focal plane. E, FM4-64 marks the plasma membrane. F, XLG2-AGB1 BiFC signal overlaps with the FM4-64-marked plasma membrane. G, XLG3 interacts with AGB1. H, FM4-64 stains the plasma membrane. I, XLG3-AGB1 BiFC signal overlaps with the FM4-64-marked plasma membrane. J, High-resolution/magnification image of the XLG3-AGB1 BiFC signal visible at the two distinct plasma membranes of two adjacent cells, marked with white arrows. K, FM4-64 specifically labels the two distinct plasma membranes. White arrows mark FM4-64-labeled vesicles. L, XLG3-AGB1 BiFC signal overlaps with the two distinct FM4-64-marked plasma membranes but not with the FM4-64-marked vesicles. Test vectors were agroinfiltrated into N. benthamiana leaves at an OD600 of 0.0075, and images were acquired 62 to 67 h post infiltration. FM4-64 was infiltrated at 50 μm just prior to imaging. Images in A to I were acquired at 63× magnification with a 1.1-μm optical slice; bars = 20 μm. Images in J to L were acquired at 95× (63× magnification plus a 1.5× zoom of the scan area during image acquisition; 0.09 μm per pixel resolution); bars = 5 μm. Yellow indicates mVenus BiFC, and red indicates FM4-64.

