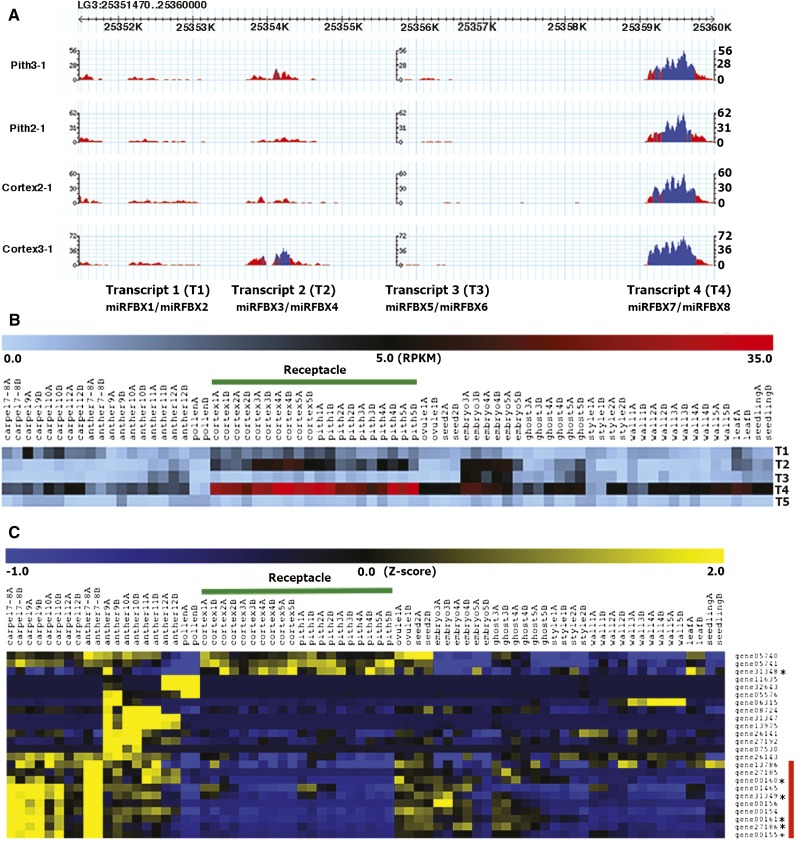
Figure 6.
miRFBX7/8 precursor transcript is specifically expressed in the receptacle fruit. A, RNA-seq read abundance displayed via GBrowse at the Genome Database for Rosaceae (GDR) on the LG3 miRFBX cluster region (LG3: 25351470–25359470). There appear to be four distinct transcription units: miRFBX1/2 (T1, transcript 1), miRFBX3/4 (T2, transcript 2), miRFBX5/6 (T3, transcript 3), and miRFBX7/8 (T4, transcript 4). Blue color indicates greater than 20× read coverage, while red color is 20× or less coverage. B, Heat map showing read abundance (reads per kilobase per million [RPKM]) of the four LG3 precursor transcripts (T1, T2, T3, and T4) shown in A and the LG5 miRFBX9 precursor transcript (labeled as T5). RNA-seq data of 37 different tissues and developmental stages (labeled by number) are shown. The two biological replicates are labeled as A and B. The receptacle (highlighted by the green line) is divided into pith and cortex at fruit developmental stages 1 to 5. C, Hierarchical clustering (Pearson correlation) showing the relative expression level of 24 FBX genes targeted by miRFBX7. Mapped reads across the same 37 tissues/stages were normalized via the Normalize Genes/Rows function in MeV4.8. The phasiRNA-producing FBX genes (triggered by miRFBX7) are marked by asterisks. The red bar on the right side donates the cluster showing reduced expression in pith and cortex of the receptacle.

