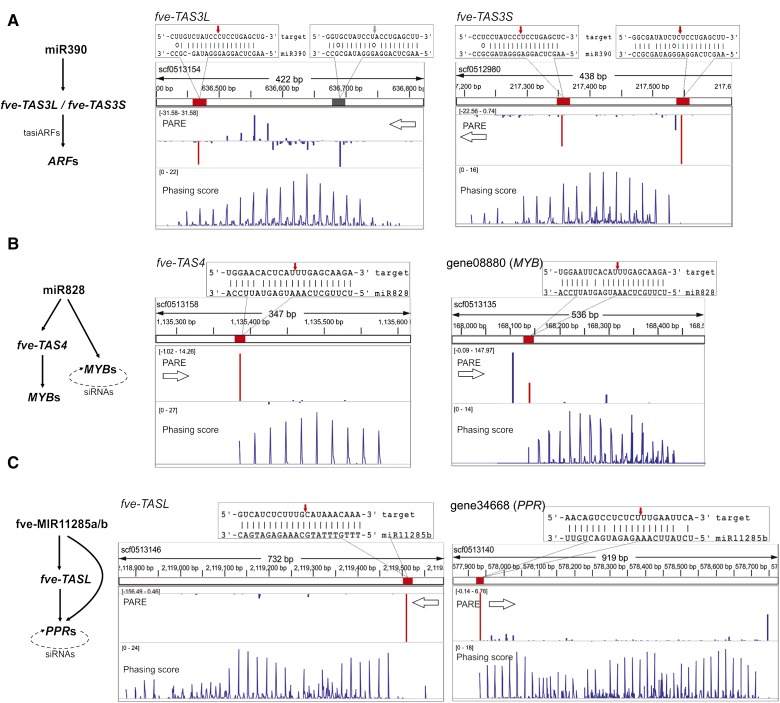
Figure 7.
Conserved tasiRNA pathways in F. vesca. Diagrams on the left illustrate conserved trans-acting pathways in F. vesca. On the right are genomic configurations of TAS genes showing three tracks: position of the miRNA target site (red or gray rectangular boxes) within the scaffold, PARE data (middle track), and phasing score (bottom track) viewed in the Integrative Genomics Viewer. Base pairing between the miRNA and corresponding transcript is enlarged above the tracks, with the exact cleavage site marked with a red or gray arrow. The gray box indicates a miR390 target site that is not cleaved. The PARE track and the phasing score track are as described in Figure 3D. The values in brackets in the PARE track and the phasing score track were derived from the flower PARE library and the flower small RNA library, respectively. A higher phasing score indicates a higher confidence of the PHAS loci. A, fve-TAS3L and fve-TAS3S are homologous genes located on different scaffolds. Each has two miR390-binding sites, indicated by the red and gray boxes in the top track. Cleavages by miR390 are shown by downward (antisense) or upward (sense) peaks. Red peaks indicate cleavage products by the indicated miRNA. Blue peaks indicate other cleavage products. B, fve-TAS4 and MYB genes are both cleaved by miR828 in typical one-hit mode. The dotted arrow in the diagram at left indicates self-cleavage by phasiRNAs. C, fve-TASL and PPR genes are each cleaved once by fve-miR11285a/b (previously named as fve-PPRtri1/2; Li et al., 2013; Xia et al., 2013). This initiates phasiRNAs revealed by the phasiRNA peaks. The dotted arrow in the diagram at left indicates self-cleavage by phasiRNAs.

