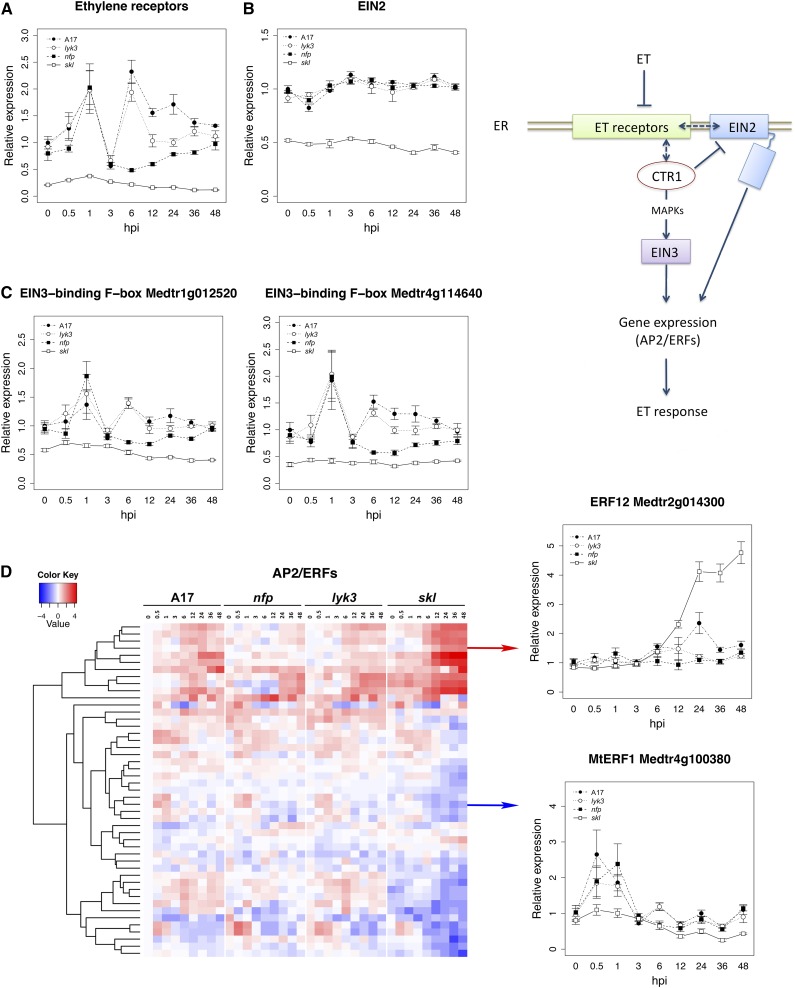
Figure 10.
Transcriptional regulation of ET signaling pathway components during early stages of symbiotic development. A, Representative expression pattern of ETRs (contig_103103_1 is represented). B, Expression profile of the gene EIN2, whose mutation is responsible for the skl phenotype. C, Expression of two genes encoding putative EIN3-binding F-box proteins. D, Heat-map representation of differentially expressed members of the AP2/ERF family. Line graphs represent relative expression values (TMM count values relative to uninoculated cv Jemalong A17). The heat map depicts relative expression values after a log2 transformation. Error bars in the line graphs represent se calculated from four independent biological replicates.

