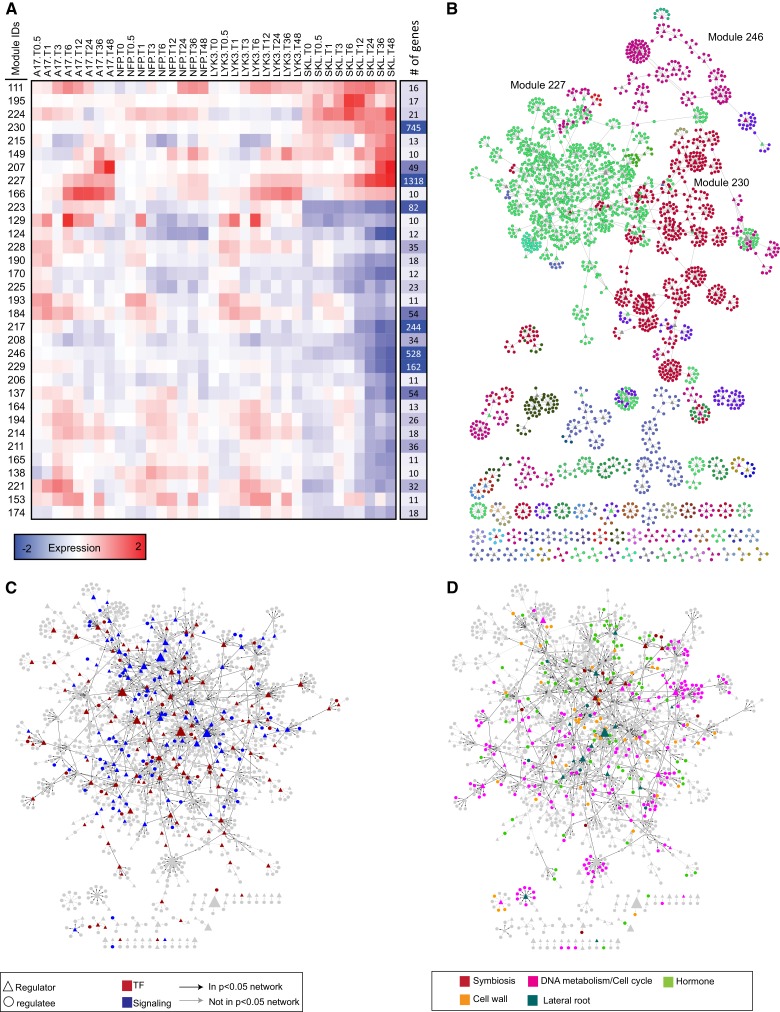
Figure 12.
MERLIN network analysis on genes in groups G1 to G4. A, Average expression patterns of the main modules identified by MERLIN. Columns on the right represent the size of the modules. B, Diagram of the regulatory network predicted by MERLIN. Each module is assigned a different color. Regulators are represented as triangles and regulated genes as circles. When a gene is predicted to regulate others, a directed arrow is shown. C, Structure of the regulatory network of TF and signaling genes associated with module 227, the most symbiosis-related module. D, Interconnection between functional categories in the regulatory network predicted for cluster 227. Black arrows indicate significant regulatory relationships (P < 0.05).

