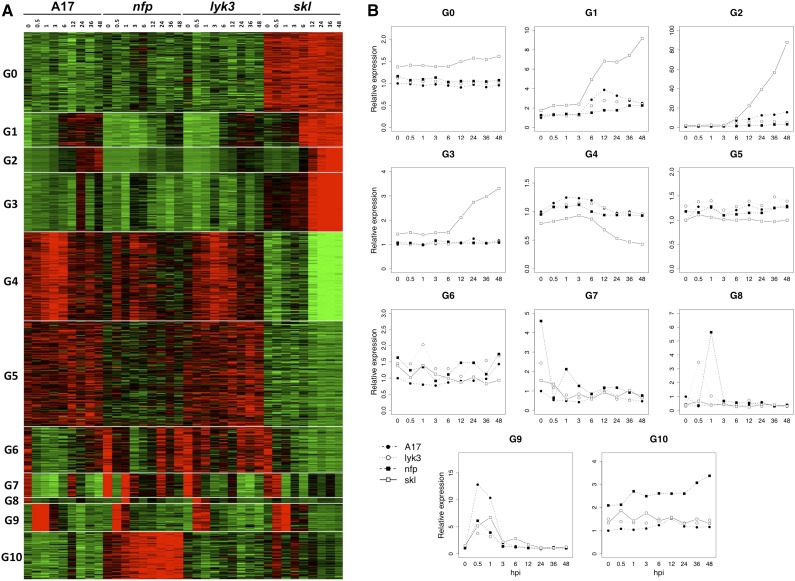
Figure 2.
Identification of 11 coexpression groups. A, Heat map representing the expression of 10,985 differentially expressed genes identified in the RNA-seq experiment, where the average Trimmed Mean of M component (TMM) count values of a given gene across all samples was used as a normalization factor. The vertical axis organizes genes according to coexpression. The horizontal axis is a genotype-specific time course. Samples with gene TMM count values larger than the average TMM count for that gene are represented in red, while samples with lower counts than the average are represented in green. Whenever transcript values are close to the average value, samples are colored in black. B, Line graphs showing the average relative expression value of all genes in that group. TMM count values of any given gene were normalized by the count value of that particular gene at 0 hpi in cv Jemalong A17. A similar methodology was used to generate all expression figures in this work.

