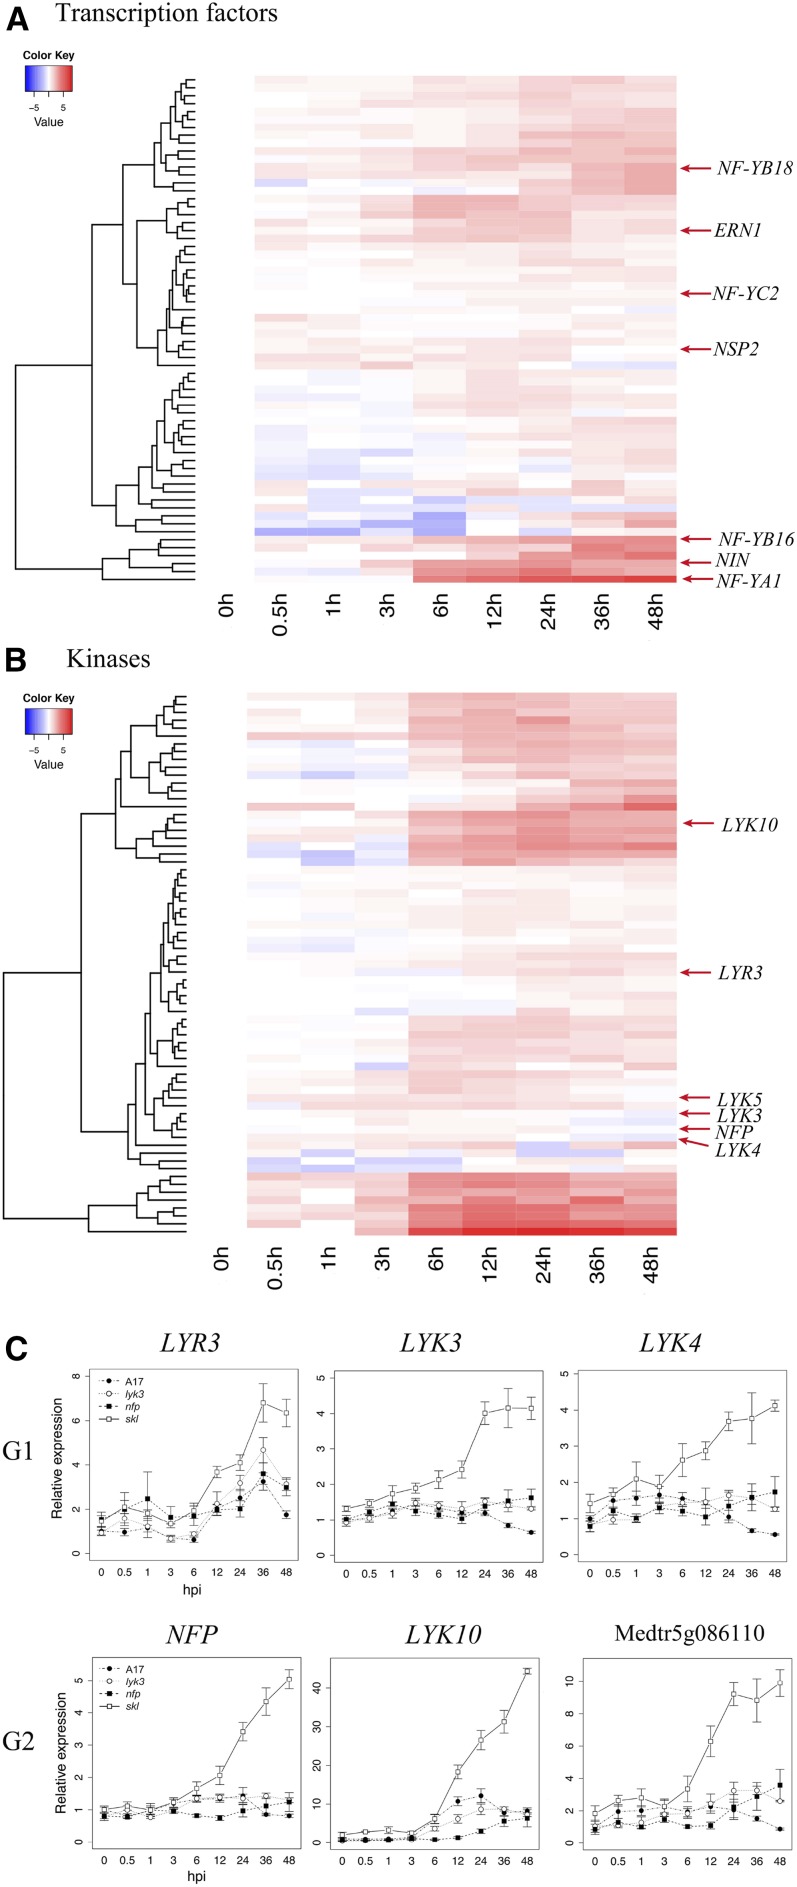
Figure 4.
Early symbiotic induction of kinases and TFs in M. truncatula ‘Jemalong A17’ at various times after inoculation. A and B, The heat maps depict the expression patterns of differentially expressed TFs (A) and kinases (B) contained within expression groups G1 to G3 (Fig. 2). C, Differentially expressed members of the LysM family of plant receptors and receptor-like kinases. Heat-map values represent log-transformed relative expression values (average TMM counts normalized to cv Jemalong A17 at 0 hpi). Line graph values correspond to average TMM counts normalized to cv Jemalong A17 at 0 hpi. NFP corresponds to IMGA 3.5 version 4 gene Medtr5g019040; LYR3, Medtr5g019050; LYK10, Medtr5g033490; LYK3, Medtr5g086130; LYK4, Medtr5g086120; and Medtr5g086110. The vertical axis dendrogram organizes genes according to coexpression. The horizontal axis is a time course for wild-type cv Jemalong A17. Error bars represent se calculated from four independent biological replicates.

