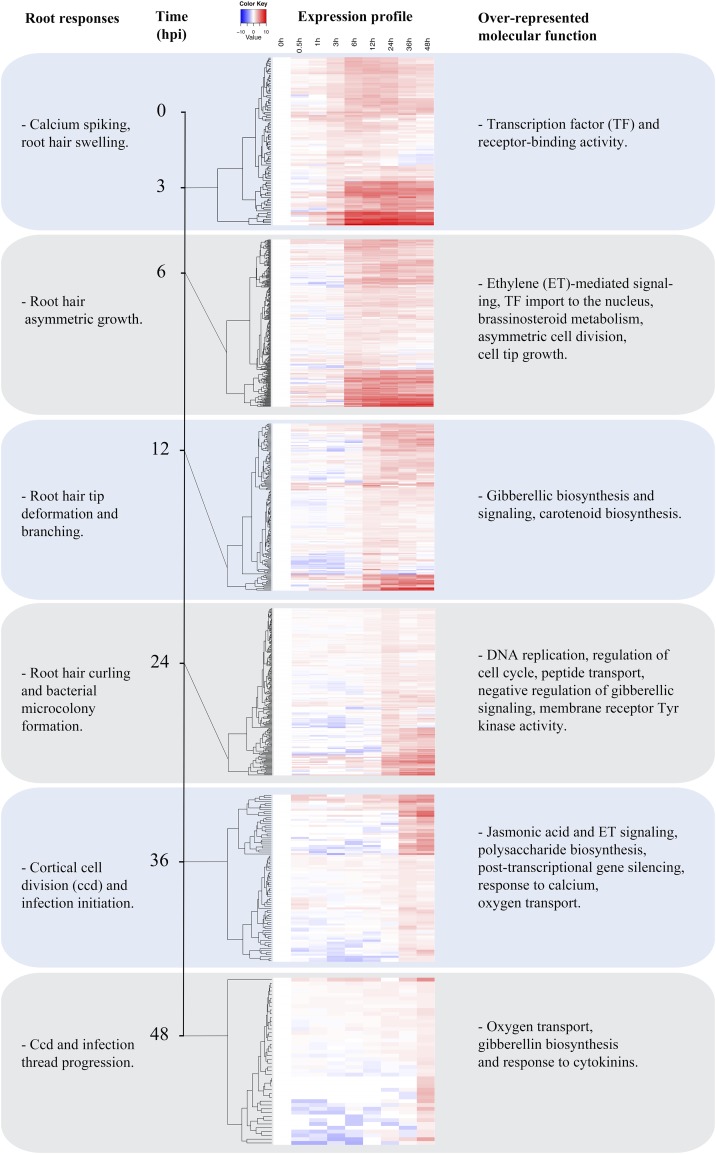
Figure 5.
Temporal dynamics of gene expression within groups G1 to G3. To further resolve gene expression patterns within the Nod factor-responsive, ET-regulated groups (Fig. 2), we organized genes based on the kinetics of their induction (1.5-fold threshold) relative to uninoculated cv Jemalong A17. Individual heat maps represent genes induced at 3, 6, 12, 24, 36, and 48 h. In each part, the vertical axis dendrogram organizes genes according to coexpression. The horizontal axis is a time course for wild-type cv Jemalong A17. Overrepresented gene functions and biological process annotations were identified in each group using Pathway Studio 9 Desktop edition and ResNet Plant version 4.

