Figure 5.
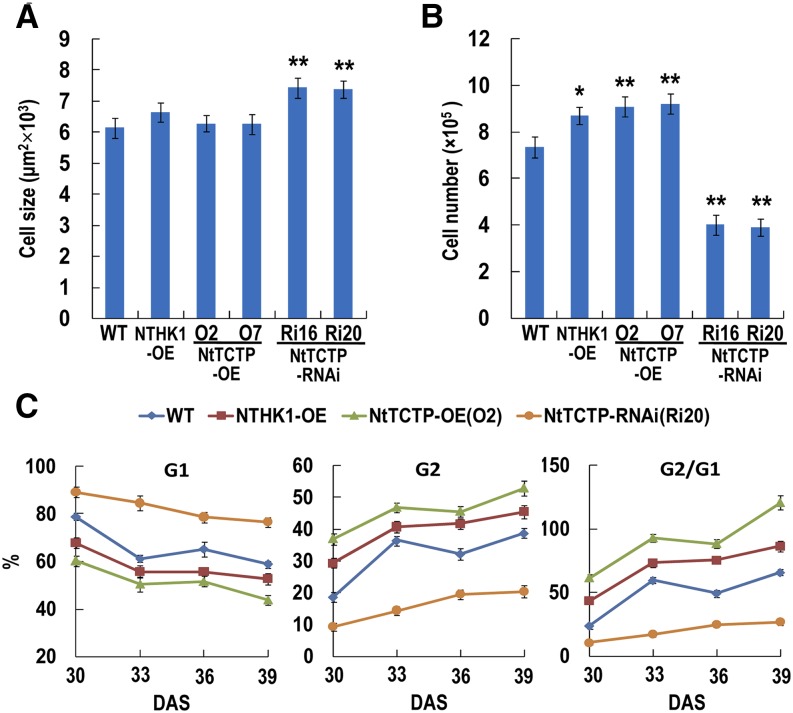
NtTCTP and NTHK1 control cell cycle and cell proliferation. A, Quantification of epidermal cell size from different tobacco lines. The sixth true leaves from 48-DAS tobacco plants were collected for SEM analysis of leaf upper epidermal cells. The data are expressed as the means ± se from three independent experimental groups (three leaves per group, four independent areas per leaf, and at least 30 cells per each area were measured using ImageJ 1.38X). **, Significant difference from the wild type (WT; Student’s t test; P < 0.01). B, Comparison of epidermal cell numbers in each leaf. The data are expressed as the means ± se of three independent experimental groups (three leaves per group). Asterisks indicate significant differences from the wild type (Student’s t test). *, P < 0.05; **, P < 0.01. C, Percentage of G1 and G2 cells and G2 to G1 ratio in the sixth true leaves of various tobacco lines. G1 and G2 indicate different phase of the cell cycle. The data are expressed as the means ± se from three independent experimental groups (eight leaves per group).

