Figure 9.
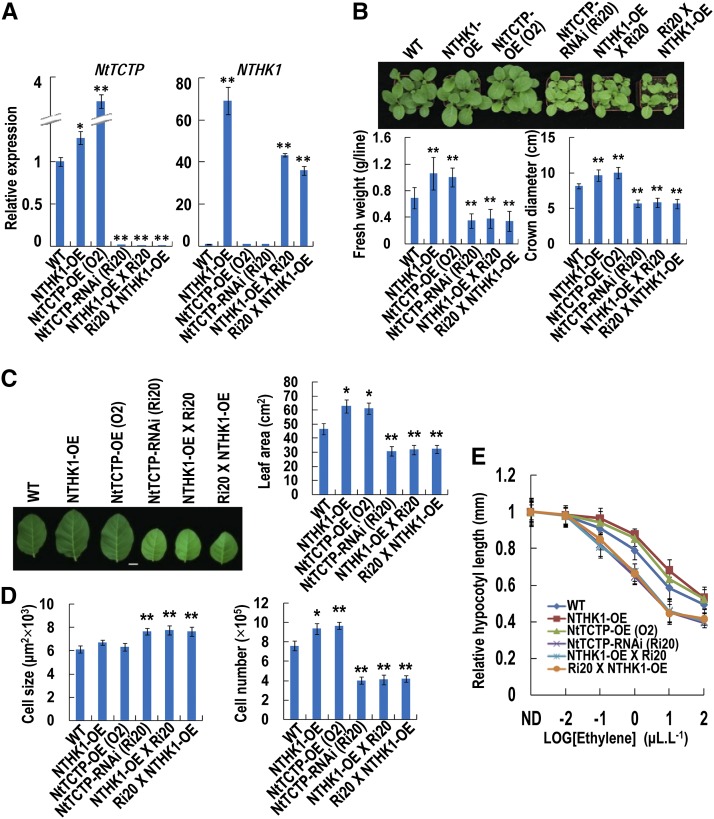
NtTCTP is required for NTHK1 to regulate plant growth and ethylene response. A, The expression levels of NtTCTP and NTHK1 in the F1 generation of the hybrids between the NTHK1-overexpressing (NTHK1-OE) line and the NtTCTP-silencing (NtTCTP-RNAi) line Ri20 were detected by qRT-PCR. Expression levels were normalized to NttubA1 and relative to the wild-type (WT) seedlings. The data are expressed as the means ± sd from three samples. Student’s t tests between the wild type and each tobacco line were performed. Three biological replicates were performed with similar results, and one of them is shown. *, P < 0.05; **, P < 0.01. B, Phenotypes of the F1 hybrids compared with wild-type and other tobacco lines. The F1 hybrids showed similar phenotypes on seedling size as the NtTCTP-silencing line. The 34-DAS seedlings of different tobacco lines growing in soil were photographed, and parameters (crown diameter and fresh weight) were measured. The data are expressed as the means ± se from three independent experiments (n = 12). **, Significant difference from the wild type (Student’s t test; P < 0.01). C, Comparison of leaf area in various plant lines. The sixth true leaves from 48-DAS tobacco plants were photographed, and leaf areas were measured. The data are expressed as the means ± se from three independent experiments (n = 10). Asterisks indicate a significant difference from the wild type (Student’s t test). Bar = 2 cm. *, P < 0.05; **, P < 0.01. D, Comparison of leaf cell size and cell number in different tobacco lines. The sixth true leaves from 48-DAS tobacco plants were collected for SEM analysis of leaf upper epidermal cells. The data are expressed as the means ± se from three independent experimental groups (three leaves per group, four independent areas per leaf, and at least 30 cells per each area were measured using ImageJ 1.38X). Asterisks indicate a significant difference from the wild type (Student’s t test). *, P < 0.05; **, P < 0.01. E, Relative hypocotyl length of 5-DAS etiolated seedlings after ethylene treatment. The data are expressed as the means ± se (n > 50). Relative hypocotyls of the F1 seedlings were significantly shorter than the wild type when the ethylene concentration was at 0.1 μL L−1 or higher (Student’s t test; P < 0.01). ND, Nondetected ethylene; NttubA1, N. tabacum tubulin alpha-1.

