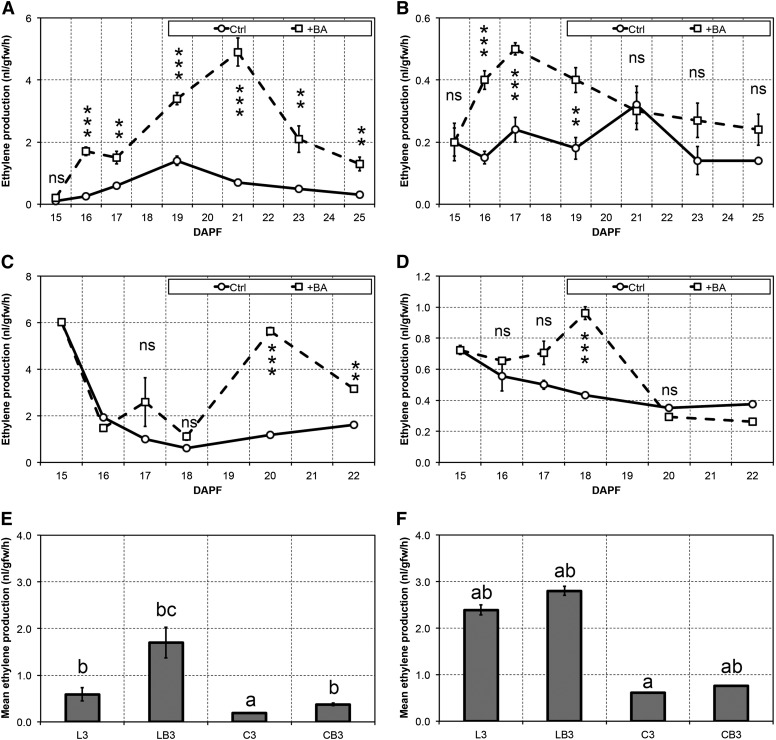
Figure 1.
A to D, Ethylene production in big lateral (left) and big central (right) fruitlets measured in untreated control (Ctrl; circles, continuous lines) and BA-treated (+BA; squares, dashed lines) samples in a successful (A and B) and in an unsuccessful (C and D) experiment. Statistically significant differences are indicated: ***, P < 0.001; and **, P < 0.01. Error bars represent se (n = 4). ns, Nonsignificant. E and F, Mean ethylene production as measured during abscission induction in a successful (E) and in an unsuccessful (F) trial. Error bars represent se (n = 16 in E), whereas letters indicate significant differences as identified by the Waller-Duncan test (P < 0.05).

