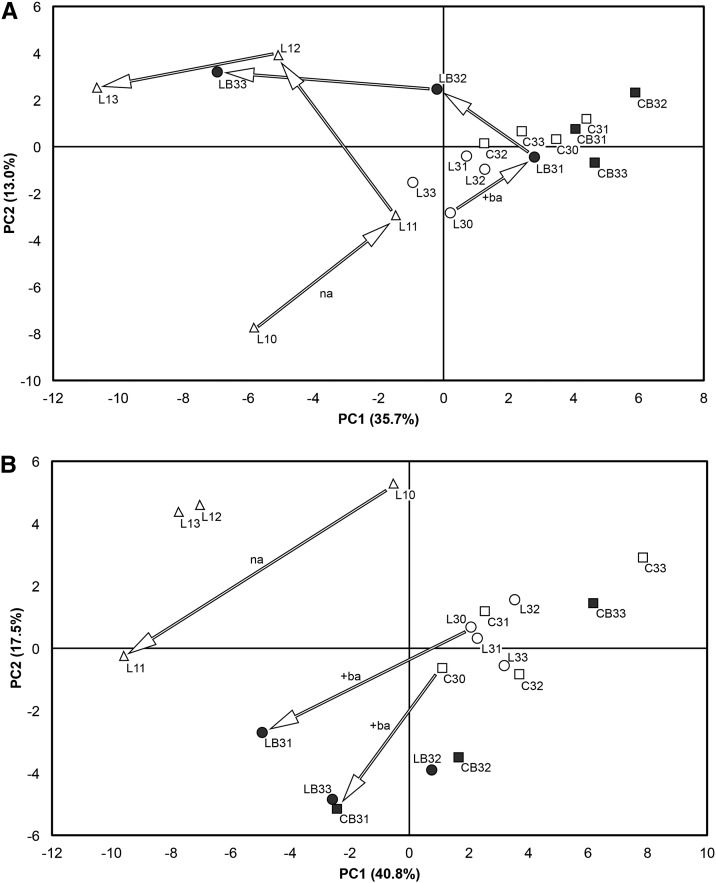
Figure 2.
PCA of ethylene-related genes. Gene expression was measured by qPCR in the following samples: L10 to L13 (small lateral fruitlets at 15–17 and 19 DAPF); L30 to L33 (big lateral fruitlets at 15–17 and 19 DAPF); LB31 to LB33 (BA-treated big lateral fruitlets at 16, 17, and 19 DAPF); C30 to C33 (big central fruitlets at 15–17 and 19 DAPF); and CB31 to CB33 (BA-treated big central fruitlets at 16, 17, and 19 DAPF). A, PCA scores plot of the first two principal components (PC1 and PC2) explaining 48.7% of the total variance in the cortex. Arrows indicate the path followed by naturally abscising fruitlets (na) and those abscising because of the BA treatment (+ba). B, PCA scores plot of the first two principal components explaining 58.3% of the total variance in the seed. Arrows indicate the early reaction of the ethylene-related transcriptome in the naturally abscising fruitlets and in those treated with BA.

