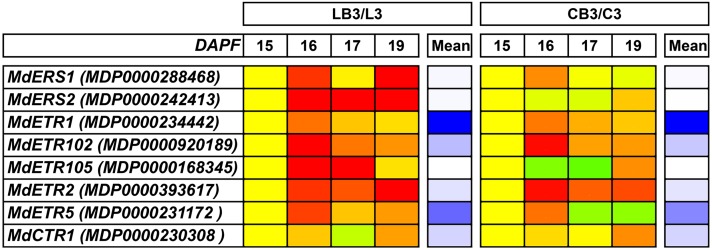
Figure 4.
Heat map showing the expression (as a log ratio) of eight selected genes during abscission induction (15–17 and 19 DAPF) in the seeds of BA-treated fruitlets with respect to their control ones (LB3/L3, BA-treated versus control big laterals; CB3/C3, BA-treated versus control big centrals). Mean expression levels are also shown with a white-blue color scale separately for each fruitlet class. The gene name and identifier are reported.

